

NCERT Solutions for Class 9 Maths Chapter 12
Statistics is the branch of mathematics concerned with collecting, organizing, analyzing, interpreting, and presenting data. This chapter introduces you to the basic concepts of handling data.
Key Concepts:
- Data Collection: Gathering information or facts about a specific topic.
- Presentation of Data: Organizing data in a clear and understandable format, such as frequency distribution tables, bar graphs, histograms, and frequency polygons.
- Measures of Central Tendency: Finding representative values for a dataset, including mean, median, and mode.
Detailed Overview:
- Data: Raw information collected for analysis.
- Frequency Distribution: Organizing data into classes or groups with their corresponding frequencies.
- Graphical Representation: Visualizing data using bar graphs (for categorical data) and histograms (for continuous data).
- Mean: The average value of a dataset.
Importance of Statistics:
- Helps in understanding and interpreting data.
- Provides insights for decision-making.
- Used in various fields like economics, science, social sciences, and more.
By the end of this chapter, you’ll be able to collect, organize, and analyze data effectively, and draw meaningful conclusions from it.
NCERT Solutions for Class 9 Maths Chapter 12
Exercise 12.1
1. A survey conducted by an organisation for the cause of illness and death among the women between the ages 15-44 (in years) worldwide, found the following figures (in %)
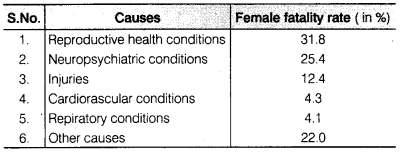
(i) Represent the information given above graphically.
(ii) Which condition is the major cause of women’s ill health and death worldwide?
(iii) Try to find out, with the help of your teacher, any two factors which play a major role in the cause in (ii) above being the major cause.
Ans :

(ii) From the bar graph, it is clear that reproductive health conditions are the major cause of women’s ill health and death worldwide.
(iii) Two factors that play a major role in reproductive health conditions being the major cause of women’s ill health and death worldwide
2. The following data on the number of girls (to the nearest ten) per thousand boys in different sections of Indian society is given below
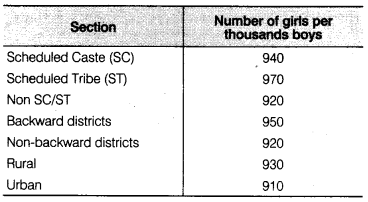
(i) Represent the information above by a bar graph.
(ii) In the classroom discuss, what conclusions can be arrived at from the graph.
Ans :
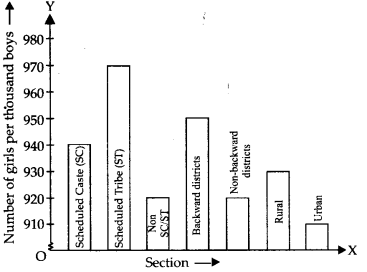
(ii )The graph highlights the critical issue of gender imbalance in India and the need for focused efforts to improve the child sex ratio, especially in urban areas and among specific social groups.
3. Given below are the seats won by different political parties in the polling outcome of a state assembly elections
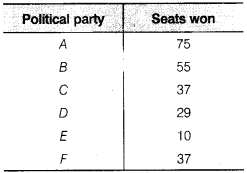
(i) Draw a bar graph to represent the polling results.
(ii) Which political party won the maximum number of seats?
Ans :

(ii) The political party A won the maximum number of seats.
4. The length of 40 leaves of a plant measured correct to one millimetre and the obtained data is represented in the following table
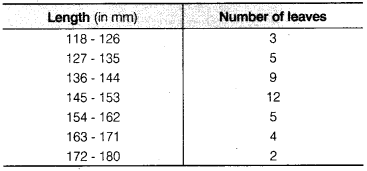
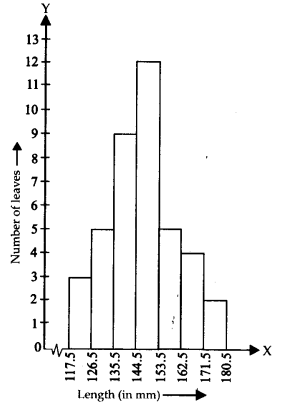
(i) Draw a histogram to represent the given data.
(ii) Is there any other suitable graphical representation for the same data?
(iii) Is it correct to conclude that the maximum number of leaves 153 mm long and Why?
Ans :
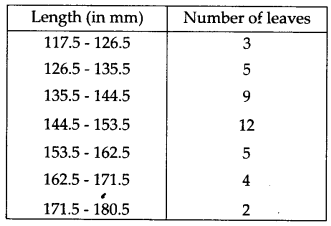
First we have to modify it to be continuous distribution.
ii) Yes, there are other suitable graphical representations for this data
iii) No, it is not correct to conclude that the maximum number of leaves are 153 mm long.
5. The following table gives the lifetimes of 400 neon lamps
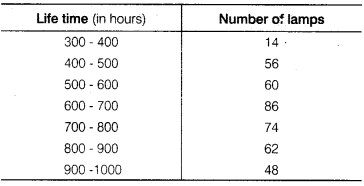
(i) Represent the given information with the help of a histogram.
(ii) How many lamps have a lifetime of more 700 h?
Ans :

(ii) The number of lamps having a lifetime of more than 700 hours is 74 + 62 + 48 = 184.
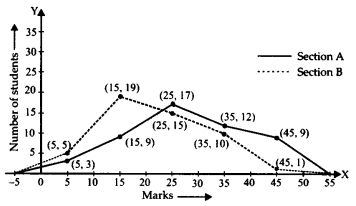
6. The following table gives the distribution of students of two sections according to the marks obtained by them
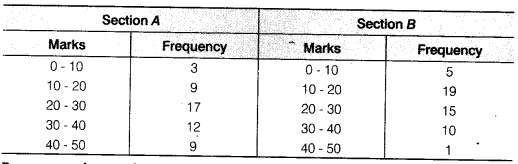
Represent the marks of the students of both the sections on the same graph by two frequency polygons. From the two polygons compare the performance of the two sections.
Ans :

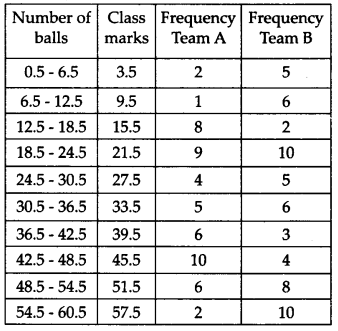
7. The runs scored by two teams A and B on the first 60 balls in a cricket match are given below
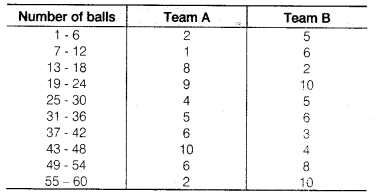
Represent the data of both the teams on the same graph by frequency polygons.
Ans :

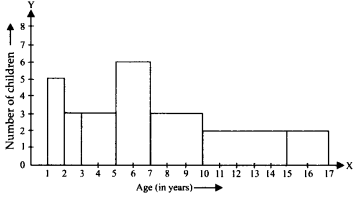
8. A random survey of the number of children of various age groups playing in a park was found as follows:
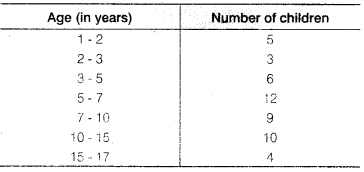
Draw a histogram to represent the data above.
Ans :

9. 100 surnames were randomly picked up from a local telephone directory and a frequency distribution of the number of letters in the English alphabet in the surnames was found as follows
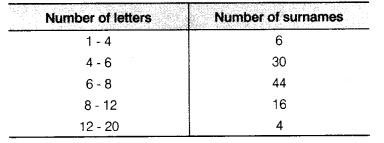
(i) Draw a histogram to depict the given information.
(ii) Write the class interval in which the maximum number of surnames lie.
Ans :
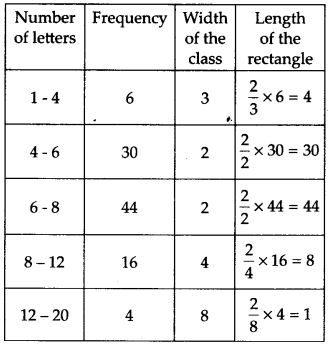

(ii) The class interval in which the maximum number of surnames lie is 6-8.
NCERT Solutions for Class 9 Maths Chapter 12
FAQ’s
What is NCERT Solutions for Class 9 Maths Chapter 12 Statistics in mathematics?
Statistics is the branch of mathematics that deals with collecting, organizing, analyzing, interpreting, and presenting data to draw meaningful conclusions.
What are NCERT Solutions for Class 9 Maths Chapter 12 the main types of graphical representation used in Statistics?
The main graphical representations are bar graphs, histograms, and frequency polygons. These help in visualizing data clearly.
What are NCERT Solutions for Class 9 Maths Chapter 12 the three measures of central tendency?
The three measures of central tendency are mean, median, and mode, which represent the average or typical value in a dataset.
Why NCERT Solutions for Class 9 Maths Chapter 12 is Statistics important in real life?
Statistics helps in making informed decisions, understanding trends, and analyzing data in fields like science, economics, health, and social studies.
What NCERT Solutions for Class 9 Maths Chapter 12 does a frequency distribution table show?
A frequency distribution table shows how often each value or range of values occurs in a dataset, helping to organize raw data into meaningful groups.
