

“So, this chapter on Maps and Diagrams basically explains that a map is like a picture that shows all or part of the Earth on a flat piece of paper, and it’s drawn carefully to show real distances accurately. Maps are super helpful for figuring out where things are, how far apart they are, and how different places connect.
The chapter probably talks about different kinds of maps too, like physical maps that show natural stuff like mountains and rivers, political maps that outline countries and cities, and thematic maps that focus on specific things like climate and population.
It might also remind us about the important parts of a map, like the title that tells you what it’s about, the directions (North, South, East, West), the scale that shows how map distances relate to real distances, symbols that represent different things, the legend that explains those symbols, the grid system for finding exact locations, and how colors are used to show different information.
Then, the chapter likely introduces diagrams, which are like simple drawings that help explain ideas, how things work, or how things are connected. Unlike maps that show places, diagrams are more about showing how things function or relate to each other.
It’ll probably cover different types of diagrams you might see, like flowcharts for showing steps, bar graphs for comparing amounts, pie charts for showing parts of a whole, line graphs for showing changes over time, and climate graphs that show both rainfall and temperature for a place.
Finally, the chapter will likely wrap up by saying that both maps and diagrams are really useful tools for learning about the world. Maps help us understand where things are located and how they relate to each other geographically, while diagrams help us picture and understand information and how things work.”
Exercises
A. Choose the correct answer
1. Which of these is shown by a thematic map ?
- mountains
- rivers
- climate
- state capitals
Answer : climate
2. These maps are useful to surveyors and civil engineers engaged in building roads, bridges, canals, and other structures.
- physical
- political
- topographic
- thematic
Answer : topographic
3. This is a true model of the earth.
- sketch
- map
- globe
- Plan
Answer : Plan
4. This is a rough drawing showing the relative locations of a few features of an area.
- globe
- map
- sketch
- Plan
Answer : sketch
5. This is a drawing that shows the horizontal section of a small area drawn to scale.
- sketch
- plan
- map
- Globe
Answer : plan
6. These are taken from space and show that the earth is spherical in shape.
- graphs
- plans
- aerial photographs
- sketches
Answer : aerial photographs
B. Explain the differences between each of the following pairs.
- An aerial photograph and a plan
- A globe and an atlas
- A sketch and a map
Ans :
An aerial photograph and a plan
| Feature | Aerial Photograph | Plan |
| Source | Captured by a camera mounted on an aircraft, drone, or satellite. | Drawn by a cartographer or architect based on precise measurements. |
| Realism | Shows the actual appearance of the ground, including colors and textures. | Uses symbols, lines, and colors to represent features (e.g., a circle for a tree). |
| Perspective | May have distortions at the edges due to the camera lens or tilt. | Is a mathematically accurate representation with a uniform scale. |
| Detail | Shows everything the camera sees, including temporary objects like cars. | Shows only relevant features; unnecessary details are omitted for clarity. |
| Labels | Usually lacks labels or text unless they are added later. | Includes extensive labels, measurements, and a legend (key). |
A globe and an atlas
| Feature | Globe | Atlas |
| Form | A three-dimensional (3D) spherical model of the Earth. | A collection or book of two-dimensional (2D) maps. |
| Accuracy | Represents the true shape of the Earth, continents, and oceans without distortion. | Contains distortions in shape, size, or distance because a curved surface is flattened. |
| Detail | Provides a general overview; cannot show specific details of small areas. | Can provide immense detail of specific regions, cities, or even streets. |
| Portability | Difficult to carry around; occupies significant space. | Very portable; can be easily carried in a bag or accessed digitally. |
| Scope | Always shows the entire Earth at once. | Can show the whole world, a single continent, a country, or a tiny town. |
A sketch and a map
| Feature | Sketch | Map |
| Basis | Based on memory and observation rather than measurements. | Based on precise measurements and survey data. |
| Scale | It is not drawn to scale. Distances are estimated. | It is always drawn to scale (e.g., 1 cm = 100 km). |
| Accuracy | Rough and informal; may not show true directions or sizes. | Highly accurate; shows true relationships between locations. |
| Details | Shows only specific landmarks used for directions. | Shows a wide variety of features using standard symbols. |
| Purpose | Used to guide someone to a specific spot quickly. | Used for navigation, planning, and geographical study. |
C. Answer the following questions in brief.
Question 1.
Define an atlas.
Answer:An atlas is essentially a book of maps. Think of it as a geographical guidebook, packed with maps of different places – countries, regions, even the whole world!
Question 2.
What do you understand about topographic maps ?
Answer:Think of topographic maps as special maps that illustrate the lay of the land. Instead of just showing locations, they use contour lines – those wiggly curves – to represent different elevations. This lets you visualize the terrain, seeing where the hills rise, the valleys dip, and how steep the slopes are. So, while regular maps tell you “where,” topographic maps show you “what” the ground looks like.
Question 3.
Which map would be most useful to army personnel when constructing a bridge during a war ?
Answer:For army personnel building a bridge in wartime, the most useful map would be a detailed topographical map. This type of map provides crucial information about the terrain, including elevation, slopes, water bodies (like the river they need to cross!), and even vegetation. This level of detail is vital for planning the bridge’s construction, ensuring its stability, and considering potential challenges posed by the landscape.
Question 4.
How will you show the location of your house to a friend who is visiting you for the first time ?
Answer: “Hey! So glad you’re coming. When you reach [Landmark near my house, e.g., the big supermarket on MG Road], give me a call. From there, head straight down [Name of street] for about two blocks. You’ll see a [Color] gate on your left – that’s my place, number [House Number].”
Question 5.
Differentiate between a plan and a sketch.
Answer:Plan: Think precise blueprint. It’s all about accurate measurements and the real layout, drawn to scale.
Sketch: Think quick, rough idea. It captures the main shape without exact details or measurements – more about the general feel.
D. Answer the following questions in one or two paragraphs
Question 1.
What is a map ? What are the different types of maps ?
Answer:Basically, a map is like a picture of a place drawn on a flat surface, shrunk down so we can see how things are laid out, how far apart they are, and how different spots connect. It’s super useful for finding our way around and understanding the world.Maps come in different flavors too! Political maps show borders, physical maps highlight nature like mountains and rivers, and thematic maps focus on specific info like how many people live somewhere or how much rain falls. You’ve also got road maps for driving and other specialized types for all sorts of things.
Question 2.
Describe a political and a physical map.
Answer:A political map spotlights how we’ve divided up the world, showing countries, states, and cities – the lines and labels of human organization and government.
A physical map, on the other hand, reveals Earth’s natural beauty, using colors to display mountains, plains, and water bodies – it’s all about the planet’s raw landscape
Question 3.
Take the help of your atlas to make a list of thematic maps. Describe any two maps from your list.
Answer:Population Density Map: This map uses colors or shading to show how many people live in different areas. Darker colors usually mean more people are packed into a space, while lighter colors indicate fewer inhabitants. It gives a clear visual of where populations are concentrated and where they are sparse.
Climate Map: This type of map uses colors and lines to represent different climate zones. You might see areas marked for tropical climates, temperate zones, or polar regions. These maps often show temperature ranges and rainfall patterns, helping you understand the typical weather conditions of various places.
Question 4.
What are the advantages and disadvantages of using a globe ?
Answer:Advantages of using a globe:
Globes are fantastic for seeing the true shape and size of continents and oceans, and they accurately show the directions and distances across the Earth in a way flat maps can’t. Plus, they give you a real feel for how the Earth spins on its axis and how different places are related to each other globally.
Disadvantages of using a globe:
On the flip side, globes can be bulky and not very detailed for small areas. It’s also impossible to see the entire world at once without constantly turning it, which can be a bit inconvenient.
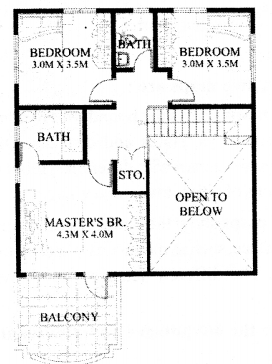
E. Draw a plan of your house showing clearly the position of each room in relation to the others. On the plan, mark clearly the positions of doors, windows and furniture.
Answer:
F. Picture study.
Question 1.
Do you know how this type of picture is taken ?
Answer:That kind of picture, showing a landscape from directly above, is very likely taken from something flying high up, like an airplane or a drone. Sometimes, it could even be from a satellite orbiting the Earth, especially if it covers a really large area. They use special cameras pointed straight down to capture that top-down view.
Question 2.
What is it used for ?
Answer: Pyrite, or “fool’s gold,” has been used for various purposes throughout history and continues to find applications today. It was once a key source of sulfur for making sulfuric acid, vital in industries like fertilizer and paper production. While it contains iron, it’s not a primary iron ore. Interestingly, pyrite can sometimes contain small amounts of gold and copper, making it a byproduct in mining these precious metals. Beyond industry, pyrite has been used to create sparks for fires. You might even find it in jewelry, often sold as “marcasite.” Beautiful pyrite crystals are also popular with mineral collectors and for decoration. In the realm of metaphysical beliefs, some believe pyrite has protective and prosperity-attracting qualities. Excitingly, ongoing research is exploring its potential in modern technologies like solar cells and batteries
