

NCERT Solutions for Class 11 Maths Chapter 13
Chapter 13: Statistics
Introduction:
- It helps us make informed decisions and understand patterns in data.
Measures of Central Tendency:
- Mean: The average value of a dataset.
- Median.
- Mode.
Measures of Dispersion:
- Range
- Variance.
- Standard Deviation: The square root of the variance.
Probability:
- Probability.
- Probability of an Event.
- Probability of Complementary Events: P(A’) = 1 – P(A).
- Conditional Probability: The probability of event B occurring given that event A has already occurred.
Binomial Distribution:
- Binomial Experiment: An experiment with a fixed number of trials, each trial having only two possible outcomes (success or failure), and the trials are independent.
- Binomial Probability: The probability of getting exactly k successes in n trials.
Other Topics:
- Frequency Distribution: A table or graph showing the frequency of each value in a dataset.
- Cumulative Frequency Distribution: A table or graph showing the cumulative frequency of each value in a dataset.
- Histogram: A bar graph where the bars are touching.
- Ogive: A graph of the cumulative frequency distribution.
- Correlation and Regression: The relationship between two variables.
Key Concepts:
- Central tendency and dispersion
- Probability
- Binomial distribution
- Frequency distributions
- Correlation and regression
NCERT Solutions for Class 11 Maths Chapter 13
Exercise 13.1
Find the mean deviation about the mean for the data in Exercises 1 and 2.
1. 4, 7, 8, 9, 10, 12, 13, 17
2. 38, 70, 48, 40, 42, 55, 63, 46, 54, 44
Ans :
1: 4, 7, 8, 9, 10, 12, 13, 17
Step 1: Calculate the mean:
Mean (x̄) = (4 + 7 + 8 + 9 + 10 + 12 + 13 + 17) / 8 = 96 / 8 = 12
Step 2: Calculate the absolute deviations:
| xi – x̄ |
| 4 – 12 | = 8
| 7 – 12 | = 5
| 8 – 12 | = 4
| 9 – 12 | = 3
| 10 – 12 | = 2
| 12 – 12 | = 0
| 13 – 12 | = 1
| 17 – 12 | = 5
Step 3: Calculate the mean deviation:
Mean Deviation = (8 + 5 + 4 + 3 + 2 + 0 + 1 + 5) / 8 = 28 / 8 = 3.5
2.
Step 1: Calculate the mean:
Mean (x̄) = (38 + 70 + 48 + 40 + 42 + 55 + 63 + 46 + 54 + 44) / 10
= 500 / 10
= 50
Step 2: Calculate the absolute deviations from the mean:
| xi – x̄ |
| 38 – 50 | = 12
| 70 – 50 | = 20
| 48 – 50 | = 2
| 40 – 50 | = 10
| 42 – 50 | = 8
| 55 – 50 | = 5
| 63 – 50 | = 13
| 46 – 50 | = 4
| 54 – 50 | = 4
| 44 – 50 | = 6
Step 3: Calculate the mean deviation:
Mean Deviation = (Σ|xi – x̄|) / n
= (12 + 20 + 2 + 10 + 8 + 5 + 13 + 4 + 4 + 6) / 10
= 84 / 10
= 8.4
Find the mean deviation about the median for the data in Exercises 3 and 4.
3. 13, 17, 16, 14, 11, 13, 10, 16, 11, 18, 12, 17
4. 36, 72, 46, 42, 60, 45, 53, 46, 51, 49
Ans :
3.
Step 1: Arrange the data in ascending order:
10, 11, 11, 12, 13, 13, 14, 16, 16, 17, 17, 18
Step 2: Calculate the median:
Since there are 12 data points, the median is the average of the 6th and 7th terms.
Median = (13 + 13) / 2 = 13
Step 3: Calculate the absolute deviations from the median:
| xi – Median |
| 10 – 13 | = 3 | 11 – 13 | = 2 | 11 – 13 | = 2 | 12 – 13 | = 1 | 13 – 13 | = 0 | 13 – 13 | = 0 | 14 – 13 | = 1 | 16 – 13 | = 3 | 16 – 13 | = 3 | 17 – 13 | = 4 | 17 – 13 | = 4 | 18 – 13 | = 5
Step 4: Calculate the mean deviation about the median:
Mean Deviation = (Σ|xi – Median|) / n
= (3 + 2 + 2 + 1 + 0 + 0 + 1 + 3 + 3 + 4 + 4 + 5) / 12
= 28 / 12
= 7/3
4.
Step 1: Arrange the data in ascending order:
36, 42, 45, 46, 46, 49, 51, 53, 60, 72
Step 2: Calculate the median:
Since there are 10 data points, the median is the average of the 5th and 6th terms.
Median = (46 + 49) / 2 = 47.5
Step 3: Calculate the absolute deviations from the median:
| xi – Median |
| 36 – 47.5 | = 11.5 | 42 – 47.5 | = 5.5 | 45 – 47.5 | = 2.5 | 46 – 47.5 | = 1.5 | 46 – 47.5 | = 1.5 | 49 – 47.5 | = 1.5 | 51 – 47.5 | = 3.5 | 53 – 47.5 | = 5.5 | 60 – 47.5 | = 12.5 | 72 – 47.5 | = 24.5
Step 4: Calculate the mean deviation about the median:
Mean Deviation = (Σ|xi – Median|) / n
= (11.5 + 5.5 + 2.5 + 1.5 + 1.5 + 1.5 + 3.5 + 5.5 + 12.5 + 24.5) / 10
= 70 / 10
= 7
Find the mean deviation about the mean for the data in Exercises 5 and 6. 5.
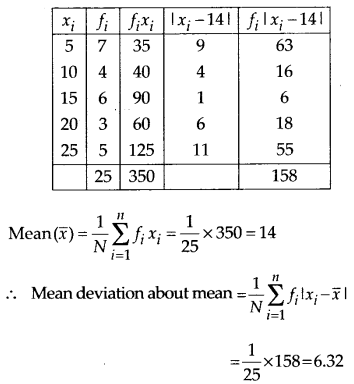
5. Xi 5 10 15 20 25
f i 7 4 6 3 5
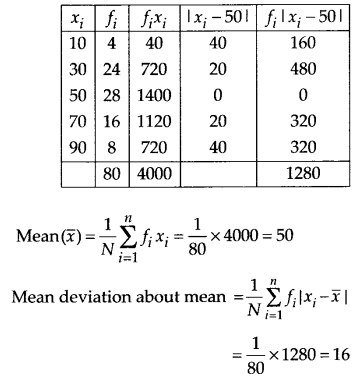
6. Xi 10 30 50 70 90
f i 4 24 28 16 8
Ans :
5.
6.
Find the mean deviation about the median for the data in Exercises 7 and 8. 7.
NCERT Solutions for Class 11 Maths Chapter 13
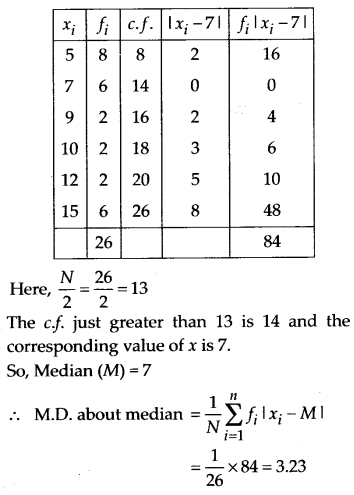
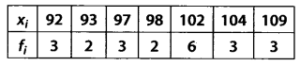
7. Xi 5 7 9 10 12 15
f i 8 6 2 2 2 6
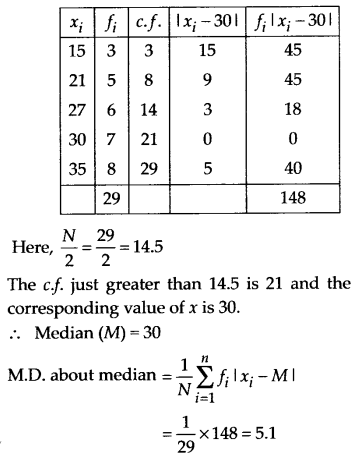
8. xi 15 21 27 30 35
f i 3 5 6 7 8
Ans :
7.
8.
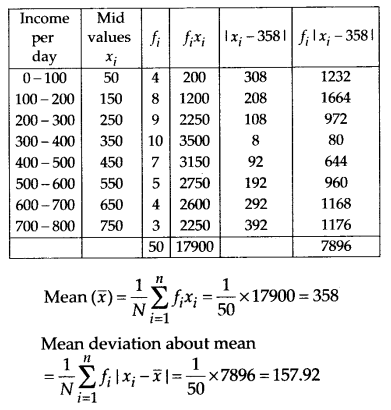
9. Find the mean deviation about the mean for the data in Exercises 9 and 10.
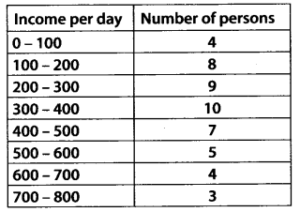
Ans :
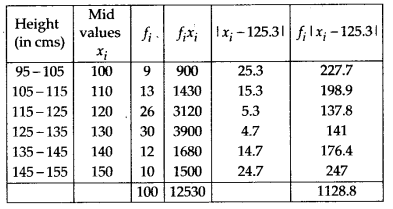
10.
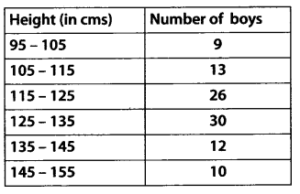
Ans :
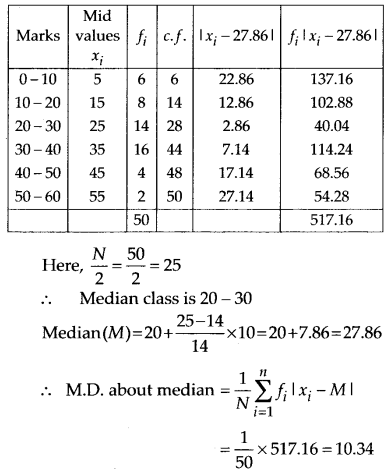
11. Find the mean deviation about median for the following data :
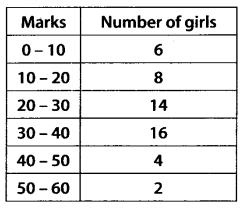
Ans :
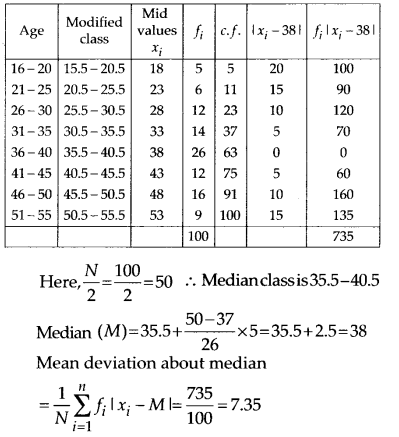
12. Calculate the mean deviation about median age for the age distribution of 100 persons given below:
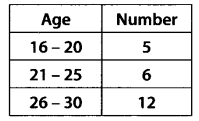
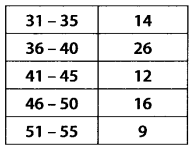
Ans :
Exercise 13.2
Find the mean and variance for each of the data in Exercies 1 to 5.
1. 6, 7, 10, 12, 13, 4, 8, 12
Ans :
Mean = (Σxi) / n
Variance = (Σ(xi – x̄)^2) / n
where:
- Σ is the summation symbol
- xi is the ith data point
- x̄ is the mean of the data
Mean = (6 + 7 + 10 + 12 + 13 + 4 + 8 + 12) / 8 = 72 / 8 = 9
Variance = ((6-9)^2 + (7-9)^2 + (10-9)^2 + (12-9)^2 + (13-9)^2 + (4-9)^2 +(8-9)^2 + (12-9)^2) / 8 = 74 / 8
= 9.25
2. First n natural numbers
Ans :
Mean:
Mean = (n + 1) / 2
Variance:
Variance = (n^2 – 1) / 12
These formulas are derived from the properties of arithmetic series.
Therefore, the mean of the first n natural numbers is (n + 1) / 2, and the variance is (n^2 – 1) / 12.
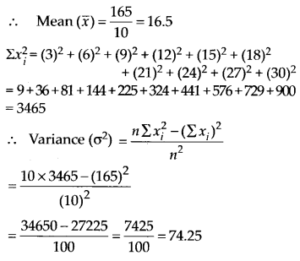
3. First 10 multiples of 3
Ans :
4.
Ans :
5.
Ans :
NCERT Solutions for Class 11 Maths Chapter 13
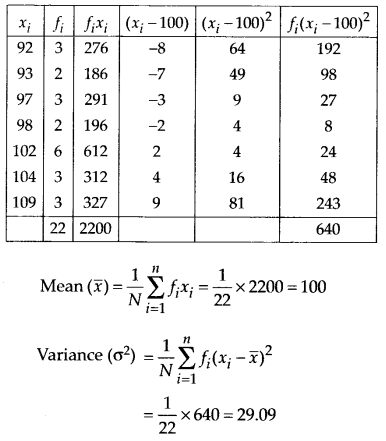
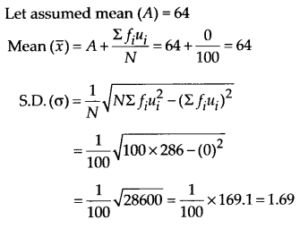
6. Find the mean and standard deviation using short-cut method.
Ans :
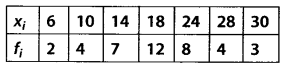
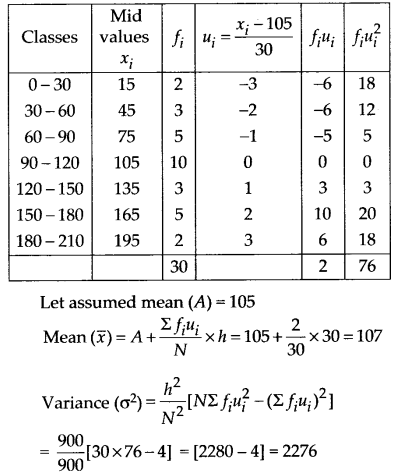
Find the mean and variance for the following frequency distributions in Exercises 7 and 8.
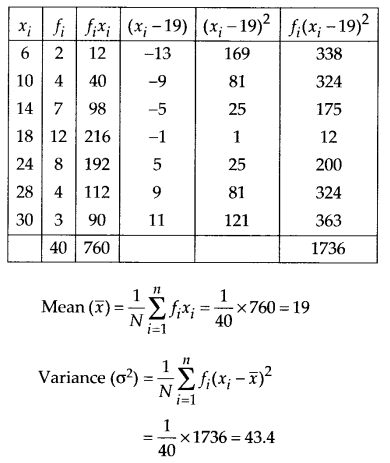
7.
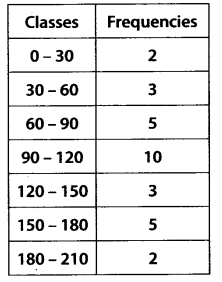
Ans :
8.
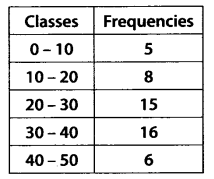
Ans :
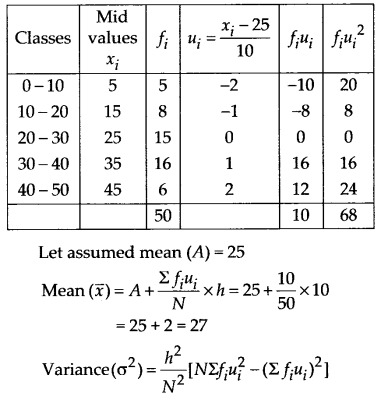
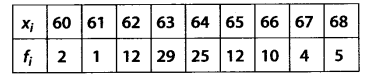
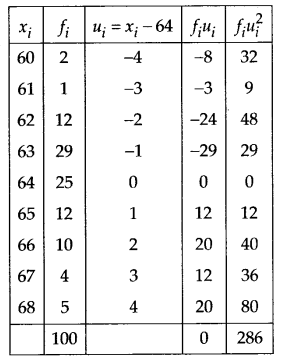
9. Find the mean, variance and standard deviation using short-cut method
Ans :
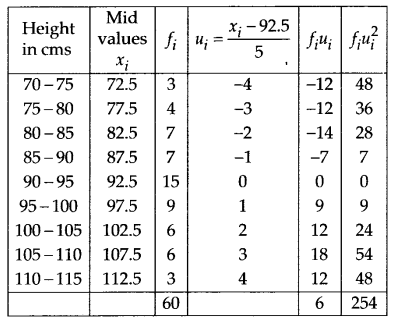
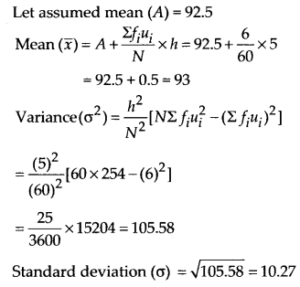
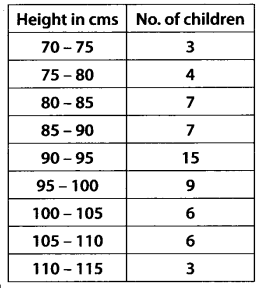
10. The diameters of circles (in mm) drawn in a design are given below:
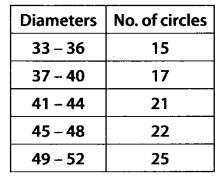
Calculate the standard deviation and mean diameter of the circles. [ Hint First make the data continuous by making the classes as 32.5-36.5, 36.5-40.5, 40.5-44.5, 44.5 – 48.5, 48.5 – 52.5 and then proceed.]
Ans :

NCERT Solutions for Class 11 Maths Chapter 13
FAQ’s
What does Class 11 Maths Chapter 13 Statistics cover?
Chapter 13 explains data collection, measures of dispersion, variance, and standard deviation to help students analyze data effectively.
Why is Statistics important in Class 11 Maths?
Statistics helps students interpret real-world data, understand patterns, and make logical decisions based on numerical information.
How do these solutions help in Chapter 13 Statistics?
The solutions provide clear, step-by-step explanations that make complex formulas and calculations easier to understand and score well.
What are the key concepts in Chapter 13?
The main concepts include range, mean deviation, variance, standard deviation, and analysis of grouped and ungrouped data.
Where can I get free Class 11 Maths Chapter 13 Statistics solutions?
You can access free Class 11 Maths Chapter 13 Statistics solutions from trusted educational websites and learning platforms.
