

Data Handling is about collecting, organizing, analyzing, interpreting, and presenting data to draw meaningful conclusions.
Key Concepts:
- Data Collection: Gathering information from various sources like surveys, observations, and experiments.
- Organization of Data: Arranging data in a systematic way using tables, charts, or graphs.
- Central Tendency: Finding representative values for a dataset, including:
- Mean: The average of a set of numbers.
- Median: The middle value in a sorted dataset.
- Mode: The most frequently occurring number in a dataset.
- Bar Graphs: Visual representation of data using rectangular bars.
- Double Bar Graphs: Comparing two sets of data using bars.
- Probability: The chance of an event happening.
By understanding these concepts, you can make informed decisions based on the information you collect and analyze.
Exercise 3.1
1. Find the range of heights of any ten students of your class.
Ans : Let’s say the heights of ten students are:
145 cm, 138 cm, 152 cm, 140 cm, 135 cm, 148 cm, 150 cm, 132 cm, 146 cm, 139 cm
- Tallest height = 152 cm
- Shortest height = 132 cm
- Range = 152 cm – 132 cm = 20 cm
2. Organise the following marks in a class assessment in a tabular form.
4, 6, 7, 5, 3, 5, 4, 5, 2, 6, 2, 5, 1, 9, 6, 5, 8, 4, 6, 7
(i) Which number is the highest?
(ii) Which number is the lowest?
(iii) What is the range of the data?
(iv) Find the arithmetic mean.
Ans :

(i) The highest number is 9.
(ii) The lowest number is 1.
(iii) The range of the data is 9 – 1 = 8.
(iv) Arithmetic mean = (4+6+7+5+3+5+4+5+2+6+2+5+1+9+6+5+8+4+6+7)/20 = 100/20 = 5
3. Find the mean of first five whole numbers.
Ans :
The first five whole numbers are: 0, 1, 2, 3, and 4.
Mean = Sum of numbers / Total number of numbers
Mean = 10 / 5 = 2
4. A cricketer scores the following runs in eight innings:
58, 76, 40, 35, 46, 45, 0, 100
Find the mean score.
Ans :
Mean score = (Total runs) / (Number of innings)
Step 1: Find the total runs
Total runs = 58 + 76 + 40 + 35 + 46 + 45 + 0 + 100 = 400
Step 2: Find the mean
Mean score = 400 runs / 8 innings = 50 runs
Therefore, the mean score of the cricketer is 50 runs.
5. Following table shows the points of each player scored in four games:
| Player | Game 1 | Game 2 | Game 3 | Game 4 |
| A | 14 | 16 | 10 | 10 |
| B | 0 | 8 | 6 | 4 |
| C | 8 | 11 | Did not play | 13 |
Now answer the following questions:
(i) Find the mean to determine A’s average number of points scored per game.
(ii) To find the mean number of points per game for C, would you divide the total points by 3 or by 4? Why?
(iii) B played in all the four games. How would you find the mean?
(iv) Who is the best performer?
Ans :
(i) Find the mean to determine A’s average number of points scored per game.
To find A’s average, we add up all their points and divide by the number of games played.
- Total points for A = 14 + 16 + 10 + 10 = 50 points
- Number of games played by A = 4
- Mean for A = Total points / Number of games = 50 points / 4 games = 12.5 points/game
So, A’s average is 12.5 points per game.
(ii) To find the mean number of points per game for C, would you divide the total points by 3 or by 4? Why?
We would divide the total points for C by 3. This is because C only played in 3 games, not 4. We need to consider only the games played when calculating the average.
(iii) B played in all the four games. How would you find the mean?
To find B’s mean, we would add up all their points and divide by the total number of games, which is 4 in this case.
- Total points for B = 0 + 8 + 6 + 4 = 18 points
- Number of games played by B = 4
- Mean for B = Total points / Number of games = 18 points / 4 games = 4.5 points/game
(iv) Who is the best performer?
To determine the best performer, we compare the averages of all players.
- A’s average = 12.5 points/game
- B’s average = 4.5 points/game
- C’s average = (8 + 11 + 13) / 3 = 32 / 3 = 10.67 points/game (approximately)
Based on the averages, A is the best performer with an average of 12.5 points per game.
6. The marks (out of 100) obtained by a group of students in a science test are 85, 76, 90, 85, 39, 48, 56, 95, 81 and 75. Find the
(i) highest and the lowest marks obtained by the students.
(ii) range of the marks obtained.
(iii) mean marks obtained by the group.
Ans :
| Statistic | Value |
| Highest marks | 95 |
| Lowest marks | 39 |
| Range of marks | 56 |
| Mean marks | 73 |
- The highest marks obtained by any student is 95.
- The lowest marks obtained by any student is 39.
- The range is the difference between the highest and lowest marks, which is 56.
- The mean marks represent the average score of all the students and is calculated by adding up all the marks and dividing by the number of students. The mean marks in this case is 73.0.
7. The enrolment in a school during six consecutive years was as follows:
1555, 1670, 1750, 2013, 2540, 2820
Find the mean enrolment of the school for this period.
Ans :
- Total enrolment = 1555 + 1670 + 1750 + 2013 + 2540 + 2820 = 12348
- Number of years = 6
- Mean enrolment = Total enrolment / Number of years = 12348 / 6 = 2058
Therefore, the mean enrolment of the school for this period is 2058 students.
8. The rainfall (in mm) in a city on 7 days of a certain week was recorded as follows:
| Day | Rainfall (in mm) |
| Monday | 0.0 |
| Tuesday | 12.2 |
| Wednesday | 2.1 |
| Thursday | 0.0 |
| Friday | 20.5 |
| Saturday | 5.5 |
| Sunday | 1.0 |
(i) Find the range of the rainfall in the above data.
(ii) Find the mean rainfall for the week.
(iii) On how many days was the rainfall less than the mean rainfall?
Ans :
(i) Range of Rainfall
- Range = Maximum value – Minimum value
- Range = 20.5 mm – 0.0 mm = 20.5 mm
(ii) Mean Rainfall
- Mean rainfall = (Total rainfall) / (Number of days)
- Total rainfall = 0.0 + 12.2 + 2.1 + 0.0 + 20.5 + 5.5 + 1.0 = 41.3 mm
- Number of days = 7
- Mean rainfall = 41.3 mm / 7 = 5.9 mm (approximately)
(iii) Days with Rainfall Less Than Mean
- Mean rainfall is 5.9 mm
- Days with rainfall less than 5.9 mm are: Monday, Wednesday, Thursday, Saturday, and Sunday.
- So, rainfall was less than the mean on 5 days.
9. The heights of 10 girls were measured in cm and the results are as follows:
135, 150, 139, 128, 151, 132, 146, 149, 143, 141
(i) What is the height of the tallest girl?
(ii) What is the height of the shortest girl?
(Hi) What is the range of the data?
(iv) What is the mean height of the girls?
(v) How many girls have heights more than the mean height?
Ans :
(i) Height of the tallest girl: 151 cm
(ii) Height of the shortest girl: 128 cm
(iii) Range of the data: Range = Highest value – Lowest value = 151 cm – 128 cm = 23 cm
(iv) Mean height: To find the mean, add all the heights and divide by the total number of girls (10).
Mean height = (135 + 150 + 139 + 128 + 151 + 132 + 146 + 149 + 143 + 141) / 10
= 1414 / 10
= 141.4 cm
(v) Number of girls with heights more than the mean height: The mean height is 141.4 cm. Girls with heights more than this are: 150 cm, 151 cm, 146 cm, 149 cm, and 143 cm. So, there are 5 girls with heights more than the mean height.
Exercise 3.2
1. The scores in mathematics test (out of 25) of 15 students is as follows:
19, 25, 23, 20, 9, 20, 15, 10, 5, 16, 25, 20, 24, 12, 20
Find the mode and median of this data. Are they same?
Ans :
Finding the Median
- Sort the scores in ascending order: 5, 9, 10, 12, 15, 16, 19, 20, 20, 20, 20, 23, 24, 25, 25
- Since we have an odd number of scores (15), the median is the middle score: 20
Finding the Mode
- The mode is the most frequent score. We can find it by counting the number of times each score appears in the data set.
- In this case, the score 20 appears four times, which is more than any other score.
Conclusion
- The median of the scores is 20.
- The mode of the scores is 20.
Yes, in this case, the median and mode are the same (20). This is because the data has a central tendency, with 20 being the most common score.
2. The runs scored in a cricket match by 11 players is as follows:
6, 15, 120, 50, 100, 80, 10, 15, 8, 10, 15
Find the mean, mode and median of this data. Are the three same?
Ans :
Mean:
- Add all the runs: 6 + 15 + 120 + 50 + 100 + 80 + 10 + 15 + 8 + 10 + 15 = 439
- Divide the total runs by the number of players: 439 / 11 = 39.91 (approximately)
Mode:
- The mode is the most frequently occurring number.
- In this case, 15 appears most frequently (3 times).
Median:
- Arrange the data in ascending order: 6, 8, 8, 10, 10, 10, 15, 15, 15, 50, 80, 100, 120
- Since there are 11 players (an odd number), the median is the middle value, which is the 6th number.
- The median is 15.
Conclusion:
- Mean = 39.91
- Mode = 15
- Median = 15
No, the mean, mode, and median are not the same.
3. The weights (in kg) of 15 students of a class are:
38, 42, 35, 37, 45, 50, 32, 43, 43, 40, 36, 38, 43, 38, 47
(i) Find the mode and median of this data.
(ii) Is there more than one mode?
Ans :
i) Mode and Median
- Mode: Multiple modes (38 and 43 appear most frequently)
Since there are 15 data points (an odd number), the median will be the middle value.
The median is the 8th value, which is 40.
So, the median weight of the students is 40 kg.
ii) Yes, there is more than one mode in this data set. In statistics, the mode is the most frequent value in a set of data. Since 38 and 43 both appear three times, there isn’t a single most frequent value, resulting in multiple modes.
4. Find the mode and median of the data:
13, 16, 12, 14, 19, 12, 14, 13, 14
Ans :
Mode:
- The mode is the most frequently occurring number in a data set.
- In this case, the number 14 appears most often (three times).
So, the mode is 14.
n = 9(odd)
∴ Median = (n+1/2) th term =(9+1/2) th term
= 5th term = 14
Hence, mode = 14 and median = 14.
5. Tell whether the statement is true or false.
(i) The mode is always one of the number in a data.
(ii) The mean is one of the numbers in a data.
(iii) The median is always one of the numbers in a data.
(iv) The data 6, 4, 3, 8, 9, 12, 13, 9 has mean 9.
Ans :
(i) The mode is always one of the number in a data.
- True. The mode is the most frequently occurring number in a dataset. Therefore, it must be one of the numbers in the data.
(ii) The mean is one of the numbers in a data.
- False. The mean is the average of all the numbers in a dataset. It doesn’t necessarily have to be one of the numbers in the data.
(iii) The median is always one of the numbers in a data.
- True. The median is the middle value when the data is arranged in order. So, it will always be one of the numbers in the data.
(iv) The data 6, 4, 3, 8, 9, 12, 13, 9 has mean 9.
- False. To find the mean, we add all the numbers and divide by the total number of numbers.
- Adding the numbers gives us 6 + 4 + 3 + 8 + 9 + 12 + 13 + 9 = 64.
- Dividing by 8 (total numbers) gives us 64 / 8 = 8.
- So, the mean is 8, not 9.
Exercise 3.3
1. Use the bar graph to answer the following questions.
(a) Which is the most popular pet?
(b) How many students have dog as a pet?
Ans :
(a) The most popular pet is Cats.
(b) There are 8 students who have a dog as a pet.
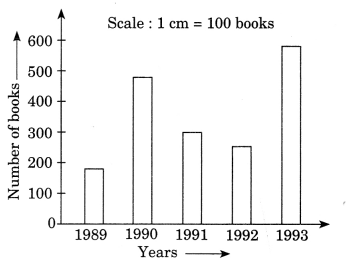
2. Read the bar graph which shows the number of books sold by a bookstore during five consecutive years and answer the following questions:
(i) About how many books were sold in 1989, 1990, 1992?
(ii) In which year were about 475 books sold? About 225 books sold?
(iii) In which year were fewer than 250 books sold?
(iv) Can you explain how you would estimate the number of books sold in 1989?
Ans :
(i) The number of books sold in the year 1989 is approximately 180, in 1990 it is around 490, and in 1992 it is about 295.
(ii) Approximately 475 books were sold in 1990, while around 225 books were sold in the year 1992.
(iii) Fewer than 250 books were sold in the years 1989 and 1992.
(iv) On the y-axis, the line is divided into 10 small parts, each representing 10 books. Thus, we can estimate that the number of books sold in 1989 is about 180.
3. Number of children in six different classes are given below. Represent the data on a bar graph.
| Class | Number of children |
| Fifth | 135 |
| Sixth | 120 |
| Seventh | 95 |
| Eighth | 100 |
| Ninth | 90 |
| Tenth | 80 |
(a) How would you choose a scale?
(b) Answer the following questions:
- Which class has the maximum number of children? And the minimum?
- Find the ratio of students of class sixth to £he students of class eighth.
Ans :
Choosing a Scale
Scale: Since the maximum number of children is 135, we can choose a scale of 1 unit on the y-axis to represent 10 children.
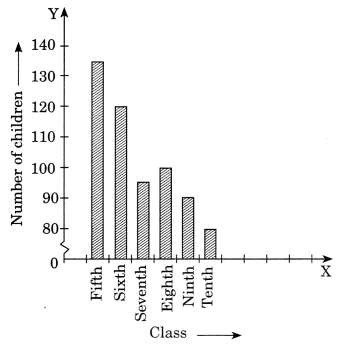
(a) Which class has the maximum number of children? And the minimum?
- The class with the maximum number of children is Fifth.
- The class with the minimum number of children is Tenth.
(b) Find the ratio of students of class sixth to the students of class eighth.
- Number of students in class sixth = 120
- Number of students in class eighth = 100
- Ratio = 120/100 = 6/5
Therefore, the ratio of students of class sixth to class eighth is 6:5.
4. The performance of a student in 1st term and 2nd term is given. Draw a double bar graph choosing appropriate scale and answer the following:
| Subject | 1st term (M.M. 100) | 2nd term (M.M. 100) |
| English | 67 | 70 |
| Hindi | 72 | 65 |
| Math | 88 | 95 |
| Science | 81 | 85 |
| S. Science | 73 | 75 |
(i) In which subject, has the child improved his performance the most?
(ii) In which subject is the improvement the least?
(iii) Has the performance gone down in any subject?
Ans :
(i) The students’ performance improved the most in Math.
(ii) The students’ performance improved the least in Social Science.
(iii) Yes, the students’ performance in Hindi has declined.
5. Consider this data collected from survey of a colony.
| Favourite sport | Watching | Participating |
| Cricket | 1240 | 620 |
| Basket ball | 470 | 320 |
| Swimming | 510 | 320 |
| Hockey | 430 | 250 |
| Athletics | 250 | 105 |
(i) Draw a double bar graph choosing an appropriate scale. What do you infer from the bar graph?
(ii) Which sport is most popular?
(iii) Which is more preferred, watching or participating in sports?
Ans :
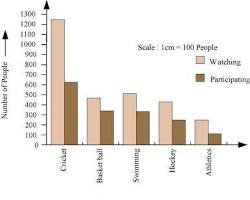
(ii) Cricket is the most popular sport as it has the highest bars for both watching and participating.
(iii) Watching sports is generally more preferred than participating.
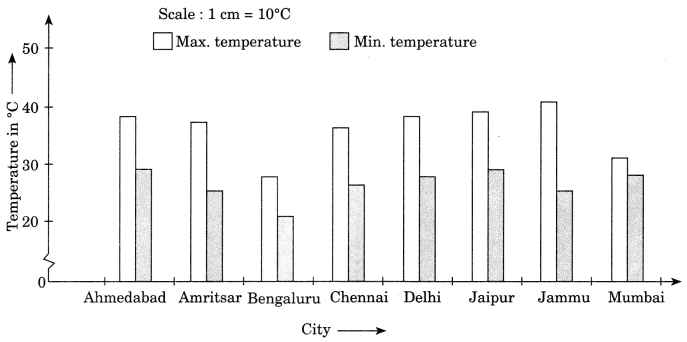
6. Take the data giving the minimum and the maximum temperature of various cities given in the beginning of this chapter. Plot a double bar graph using the data and answer the following:
(i) Which city has the largest difference in the minimum and maximum temperature on the given date?
(ii) Which is the hottest city and which is the coldest city?
(iii) Name two cities where maximum temperature of one was less than the minimum temperature of the other.
(iv) Name the city which has the least difference between its minimum and maximum temperature.
| Temperature of cities as on 20.6.2006 | ||
| City | Max. | Min. |
| Ahmedabad | 38°C | 29°C |
| Amritsar | 37°C | 26°C |
| Bengaluru | 28°C | 21°C |
| Chennai | 36°C | 27°C |
| Delhi | 38°C | 28°C |
| Jaipur | 39°C | 29°C |
| Jammu | 41°C | 26°C |
| Mumbai | 32°C | 27°C |
Ans :
(i) Which city has the largest difference in the minimum and maximum temperature on the given date?
To find the largest difference, we subtract the minimum temperature from the maximum temperature for each city.
- Ahmedabad: 38°C – 29°C = 9°C
- Amritsar: 37°C – 26°C = 11°C
- Bengaluru: 28°C – 21°C = 7°C
- Chennai: 36°C – 27°C = 9°C
- Delhi: 38°C – 28°C = 10°C
- Jaipur: 39°C – 29°C = 10°C
- Jammu: 41°C – 26°C = 15°C
- Mumbai: 32°C – 27°C = 5°C
Jammu has the largest difference in temperature with 15°C.
(ii) Which is the hottest city and which is the coldest city?
- The hottest city is Jammu with a maximum temperature of 41°C.
- The coldest city is Bengaluru with a minimum temperature of 21°C.
(iii) Name two cities where the maximum temperature of one was less than the minimum temperature of the other.
There are no such cities in the given data. The maximum temperature of every city is higher than the minimum temperature of any other city.
(iv) Name the city which has the least difference between its minimum and maximum temperature.
- Mumbai has the least difference in temperature with only 5°C between its maximum and minimum temperatures.
