
")
The chapter “Motion in One Dimension” introduces the fundamental concepts of describing the movement of an object along a straight line. It begins by defining key terms like distance (the total path length covered, a scalar quantity) and displacement (the shortest straight-line distance between the start and end points, a vector quantity). Similarly, it distinguishes between speed (the rate of covering distance, a scalar) and velocity (the rate of change of displacement, a vector). The concept of acceleration is introduced as the rate of change of velocity, which can be positive (speeding up) or negative (slowing down, also called retardation). A body is said to be in uniform motion when it covers equal distances in equal intervals of time, meaning its speed is constant.
A major focus of the chapter is on the graphical representation of motion and the derivation of essential equations. By studying distance-time graphs, one can determine the speed of an object, where the slope of the graph gives the speed (or velocity). More importantly, velocity-time graphs are explored in detail. The slope of a velocity-time graph gives the acceleration of the object, while the area under the graph represents the displacement covered. These graphical insights lead to the derivation of the three fundamental equations of motion for uniformly accelerated motion: v=u+at, s=u+1/2at, and u2+2as, where uu is initial velocity, vv is final velocity, aa is acceleration, tt is time, and ss is displacement.
Finally, the chapter applies these concepts to a specific and important case: motion under gravity. The acceleration due to gravity (g), which is approximately 9.8 m/s2 directed towards the centre of the Earth, is used as a constant acceleration in the equations of motion. This allows for the analysis of objects in free fall or those projected vertically upwards. Students learn to solve numerical problems by substituting aa with +g or −g depending on the direction chosen as positive, thereby calculating quantities like maximum height reached, time of flight, and velocity upon hitting the ground for objects moving vertically.
Exercise 2 (A)
Question 1.
Differentiate between the scalar and vector quantities, giving two examples of each.
Ans:
| Feature | Scalar Quantity | Vector Quantity |
| Definition | A physical quantity fully described by its magnitude (size or numerical value) alone. | A physical quantity fully described by both magnitude and direction. |
| Direction | Has no associated direction. | Has a specific direction in space. |
| Addition | Follows ordinary rules of algebra (simple arithmetic). | Follows special rules of vector algebra (e.g., triangle law, parallelogram law). |
| Examples | Mass, Time, Speed, Temperature, Distance, Energy. | Force, Velocity, Acceleration, Displacement, Momentum. |
Examples
Scalar Quantities
- Mass: A person’s mass is 70 kg, regardless of direction.
- Time: The duration of a trip is 2 hours, which is a value only.
Vector Quantities
- Velocity: A car is moving at 60 km/h East. (Magnitude and direction).
- Force: A push of 10 Newtons applied downward on a box. (Magnitude and direction).
Question 2.
State whether the following quantity is a scalar or vector.
- Pressure
- Force
- Momentum
- Energy
- Weight
- Speed
Ans:
| Quantity | Classification | Reason |
| Pressure | Scalar | It has magnitude but no unique direction; it acts in all directions on a surface. |
| Force | Vector | It has both magnitude (strength) and a specific direction (the way the push or pull is applied). |
| Momentum | Vector | It is the product of mass (scalar) and velocity (vector), so it has the same direction as velocity. |
| Energy | Scalar | It is a measure of the capacity to do work and is not associated with a specific direction. |
| Weight | Vector | It is a measure of the gravitational force on an object, acting specifically downward toward the center of the celestial body. |
| Speed | Scalar | It is the rate of motion (distance over time) and is defined only by its magnitude. |
Question 3.
When is a body said to be at rest?
Ans:
A body is said to be at rest if its position does not change with respect to its surroundings (or a defined reference point) over a period of time.
In physics, the state of rest is relative, meaning it depends entirely on the observer’s frame of reference.
- Simple View: A book lying on a table is at rest with respect to the table and the room.
- Physics View (Relativity): That same book is in motion with respect to the Sun because the Earth is constantly moving (rotating and orbiting). Therefore, an object is only “at rest” relative to what you choose to compare it with.
Question 4.
When is a body said to be in motion?
Ans:
An object is defined as being in motion when its location shifts relative to a chosen point of reference as time elapses.
Question 5.
What do you mean by motion in one direction?
Ans:
Motion in one direction, also known as one-dimensional motion or rectilinear motion, is the movement of an object exclusively along a single straight line without any change in the path’s direction.
Essentially, it is the simplest form of motion in physics:
- Straight Path: The object’s entire trajectory is a straight line.
- Single Axis: The movement can be fully described using only one spatial coordinate (like the x-axis for horizontal motion or the y-axis for vertical motion).
- Unchanging Direction: The object does not turn, swerve, or veer off the straight path. It moves either forward or backward along that single line.
Question 6.
Define displacement. State its unit.
Ans:
Displacement: A Unique Definition
Displacement (Δx) is defined as the change in position of an object. It is the straight-line distance measured from an object’s starting point to its ending point, which necessarily includes the direction of that change.
It is a vector quantity, characterized by both its size (magnitude) and its orientation.
The mathematical formula for calculating displacement is:
Δx=xf−xi
Where:
- Δx is the displacement.
- xf is the final position.
- xi is the initial position.
The standard unit of displacement within the International System of Units (SI) is the meter (m).
Question 7.
Differentiate between distance and displacement.
Ans:
| Feature | Distance | Displacement |
| Definition | The total length of the actual path covered by an object during its motion. | The shortest straight-line path between the object’s initial and final positions. |
| Type of Quantity | Scalar quantity (only magnitude). | Vector quantity (both magnitude and direction). |
| Value | Can only be positive (or zero if the object is stationary). | Can be positive, negative, or zero. |
| Path Dependence | Depends on the actual path taken. | Independent of the path taken; only depends on the start and end points. |
| Relationship | Always greater than or equal to the magnitude of the displacement ($\text{Distance} \ge | \text{Displacement} |
Question 8.
Can displacement be zero even if the distance is not zero? Give one example to explain your answer.
Ans:
The concept that displacement can be zero even if the distance is not zero arises from the definitions of these two quantities:
- Displacement (Δx) is a vector quantity that measures the shortest straight-line change in an object’s position, calculated as:
Δx=xfinal−xinitial - Distance is a scalar quantity that measures the total length of the path actually traveled by the object.
Explanation of the Phenomenon
When an object in motion returns to its exact starting point, its displacement is zero, even though it has covered a non-zero distance.
- Zero Displacement: If the object’s final position (xfinal) is identical to its initial position (xinitial), the net change in position is zero.
Δx=xinitial−xinitial=0 - Non-Zero Distance: Distance, however, measures every segment of the path taken. As long as the object moved at all, the total path length (distance) will be a positive, non-zero value.
Illustrative Example
Consider a cyclist who completes a closed loop or circuit.
| Quantity | Value | Reasoning |
| Distance | 5 kilometers (non-zero) | This is the total length of the road or path the cyclist traveled. |
| Displacement | 0 kilometers (zero) | The cyclist’s journey ended precisely where it began, resulting in no net change in position. |
Question 9.
When is the magnitude of displacement equal to the distance?
Ans:
The magnitude of displacement is equal to the distance traveled when a body moves along a straight line in a single, fixed direction without changing its path or reversing its course.
- Distance is the total length of the path covered (a scalar quantity).
- Displacement is the shortest straight-line distance between the starting and ending points (a vector quantity).
When motion is strictly along a straight line and does not turn back, the total path length is the same as the shortest distance between the start and end points.
Question 10.
Define velocity. State its unit.
Ans:
Velocity is formally defined as the rate at which an object changes its position in a specific direction. It is a vector quantity, which fundamentally means its description includes two essential components:
- Magnitude (Speed): This describes how fast the object is moving.
- Direction: This specifies the orientation or path of the movement.
Formula and Unit
The mathematical expression for average velocity (v) is the ratio of the change in displacement (Δd) to the corresponding change in time (Δt):
v=Δt / Δd
The SI unit (International System of Units) for velocity is metres per second (m/s) or m⋅s−1.
Question 11.
Define speed. What is its S.I. unit?
Ans:
Speed is defined as the rate at which an object covers distance.
It is a scalar quantity that only indicates how fast an object is moving, without regard to the direction of motion.
Mathematically, it is calculated as:
Speed=Time Taken / Distance Traveled
The S.I. (International System) unit of speed is:Metre per second (m/s or m⋅s−1)
Question 12.
Distinguish between speed and velocity.
Ans:
| Feature | Speed | Velocity |
| Definition | The rate at which an object covers distance. | The rate at which an object changes its displacement (position). |
| Quantity Type | Scalar | Vector |
| Components | Has magnitude (size) only. | Has magnitude (speed) and direction. |
| Formula | Average Speed =Total Time / Total Distance | Average Velocity =Total Time / Displacement |
| Possible Values | Always positive or zero (never negative). | Can be positive, negative, or zero. |
| Direction Change | An object can change direction without its speed changing (e.g., driving in a circle at 60 km/h). | A change in direction always results in a change in velocity, even if the speed is constant. |
| Example | 50 km/h | 50 km/h East |
Question 13.
Which quantity-speed or velocity-gives the direction of motion of a body?
Ans:
The concept that defines a body’s direction of movement is velocity.
Velocity is classified as a vector quantity, which means its description requires both a magnitude (how fast the body is moving, or its speed) and a direction (the way it is traveling). Conversely, speed is a scalar quantity; it only indicates the rate of motion without any reference to the path or direction taken.
Question 14.
When is instantaneous speed the same as the average speed?
Ans:
The instantaneous speed of a body is equal to its average speed only when the body’s motion is characterized by uniform (constant) speed throughout the entire time interval.
Here’s a concise explanation of why this is the case:
- Uniform Speed: This state means the object covers equal distances in equal intervals of time. The value of the speed never changes.
- Instantaneous Speed: This is the speed of the object measured at one specific, precise moment. If the speed is uniform, this measurement is the same constant value at every instant.
- Average Speed: This is the total distance traveled divided by the total time taken.
When the speed remains constant throughout the journey, the value of the speed at any single instant (instantaneous speed) is the same as every other instant. Therefore, calculating the average of all these identical values over the total time must also yield that same constant value (average speed = instantaneous speed).
Question 15.
Distinguish between uniform velocity and variable velocity.
Ans:
The distinction between uniform and variable velocity lies in whether the body’s rate of displacement remains constant or changes over time.
Uniform Velocity
An object is said to have uniform velocity (or constant velocity) if it travels with equal displacements in equal intervals of time, regardless of how small those intervals are.
| Characteristic | Description |
| Definition | The magnitude (speed) and direction of the body’s velocity remain constant over time. |
| Path of Motion | Must be a straight line (rectilinear motion). |
| Acceleration | Zero (a=0), because the velocity is not changing. |
| Example | A train moving at a steady 60 km/h East along a straight, level track. |
Variable Velocity (Non-Uniform Velocity)
An object is said to have variable velocity if its velocity changes over a period of time. Since velocity is a vector quantity, a change in either its magnitude or its direction will result in variable velocity.
| Characteristic | Description |
| Definition | The velocity changes over time, meaning either the magnitude (speed), the direction, or both are changing. |
| Path of Motion | Can be a straight line (if speed changes) or a curved path (if direction changes). |
| Acceleration | Non-zero (a=0), as a change in velocity defines acceleration. |
| Example | A car slowing down at a traffic light (speed changes) or an object moving in a circle at a constant speed (direction changes). |
Question 16.
Distinguish between average speed and average velocity.
Ans:
| Feature | Average Speed | Average Velocity |
| Definition | Ratio of total distance traveled to the total time taken. | Ratio of total displacement (change in position) to the total time taken. |
| Formula | Average Speed=Total Time / Total Distance | Average Velocity=Total Time / Total Displacement |
| Type of Quantity | Scalar (magnitude only, no direction). | Vector (both magnitude and direction). |
| Value in Round Trip | Cannot be zero (if motion occurred, distance is positive). | Can be zero (if the object returns to its starting point, displacement is zero). |
| Path Dependence | Depends on the actual path taken (distance). | Depends only on the initial and final positions (displacement). |
Question 17.
Give an example of the motion of a body moving with a constant speed but with a variable velocity. Draw a diagram to represent such a motion.
Ans:
Example: Uniform Circular Motion
- Constant Speed (Scalar): The object covers the same distance in every unit of time. The magnitude of its velocity (the speed) remains unchanged. For instance, a car driving around a perfectly circular track always at 40 km/h.
- Variable Velocity (Vector): Although the speed is constant, the direction of the motion is continuously changing as the object follows the curve of the circle. Since velocity is a vector quantity (magnitude + direction), a change in direction means the velocity itself is changing.
This change in velocity results in an acceleration that is always directed toward the center of the circle (called centripetal acceleration).
Diagram Representation
The motion can be represented by a circle with velocity vectors drawn tangentially at different points.
In the diagram:
- Magnitude (Speed): The length of the velocity vectors (v1, v2, v3) is the same, indicating constant speed.
- Direction (Velocity): The direction of the velocity vectors is different at every point (tangent to the circle), indicating a variable velocity.
- Acceleration (a): The acceleration vector always points toward the center of the circle, showing the direction of the change in velocity.
Question 18.
Give an example of motion in which the average speed is not zero but the average velocity is zero.
Ans:
This condition occurs when a body returns to its starting point after having moved for some time.
- Average Velocity is Zero:
Average Velocity=Total Time / Total Displacement
Since the body ends up at the same place it started, the Total Displacement (the shortest distance between the initial and final position) is zero, making the average velocity zero. - Average Speed is Non-Zero:
Average Speed=Total Time / Total Distance Traveled
The body actually traveled a path, so the Total Distance Traveled is non-zero, resulting in a non-zero average speed.
Example
A car drives one lap around a circular race track.
Question 19.
Define acceleration. State its unit.
Ans:
Acceleration describes how an object’s velocity transforms over a specific time interval. Since velocity combines speed with direction, acceleration occurs whenever there is a change in the object’s speed, its direction of travel, or both. Essentially, it quantifies how swiftly motion is being altered.The mathematical expression for average acceleration is the difference between the final and initial velocity divided by the time taken for that change, or a = (v – u)/t.As a derived vector quantity, its standard unit in the International System (SI) is the meter per second squared (m/s²). This unit logically follows from its definition: it represents the change in velocity (measured in m/s) that occurs during each second of time.
Question 20.
Distinguish between acceleration and retardation.
Ans:
| Aspect | Acceleration | Retardation (Deceleration) |
| Basic Meaning | The rate at which the velocity increases with time. | The rate at which the velocity decreases with time. |
| Mathematical Sign | Generally considered positive (+a). | Defined as negative acceleration (−a). |
| Direction of Force/Vector | The acceleration vector acts in the same direction as the motion/velocity. | The acceleration vector acts opposite to the direction of the motion/velocity. |
| Effect on Speed | Causes the object’s speed to increase. | Causes the object’s speed to decrease. |
| Example | A car pressing the gas pedal to pass another vehicle. | A car applying the brakes to stop at a red light. |
Question 21.
Differentiate between uniform acceleration and variable acceleration.
Ans:
Uniform Acceleration (Constant Acceleration)
Definition: A body is said to be in uniform acceleration when its velocity changes by equal amounts in equal intervals of time, regardless of how small those time intervals are. This means the acceleration remains constant in both magnitude and direction.
| Characteristic | Description |
| Acceleration Value | Constant (e.g., 5 m/s2 at t=1 s, t=2 s, and t=3 s). |
| Velocity Change | Equal change in velocity (Δv) for every equal time interval (Δt). |
| Motion Type | Possible to use the standard equations of motion (kinematic equations). |
| Example | An object in free fall (ignoring air resistance), where the acceleration is constant, a=9.8 m/s2 (or g). |
| v−t Graph | A straight line with a non-zero, constant slope. |
Variable Acceleration (Non-Uniform Acceleration)
Definition: A body is said to be in variable acceleration when its velocity changes by unequal amounts in equal intervals of time. This means the acceleration is not constant; it changes in magnitude, direction, or both over time.
| Characteristic | Description |
| Acceleration Value | Changes with time (e.g., a might be 3 m/s2 at t=1 s and 7 m/s2 at t=2 s). |
| Velocity Change | Unequal change in velocity (Δv) for equal time intervals (Δt). |
| Motion Type | Requires calculus (differentiation and integration) to accurately describe the motion. |
| Example | A car driving in heavy traffic, constantly speeding up, slowing down, and turning. |
| v−t Graph | A curved line with a slope that continuously changes. |
Question 22.
What is meant by the term retardation? Name its S.I. unit.
Ans:
The term retardation is an older or alternative term used in physics to mean negative acceleration or deceleration.
Retardation
Retardation is defined as the rate of decrease of velocity of a body with respect to time.
It occurs when the acceleration vector of a moving object is directed opposite to its velocity vector, causing the object to slow down.
- Example: When a driver applies the brakes on a car, the car is undergoing retardation.
S.I. Unit
Since retardation is a form of acceleration, its S.I. unit is the same as that of acceleration.
S.I. unit of Retardation=metre per second squared(m/s2)
Question 23.
Which of the quantity-velocity or acceleration-determines the direction of motion?
Ans:
The direction of motion of a body is determined by its velocity.
Here’s a brief explanation:
- Velocity (v): This vector quantity describes both the speed and the current direction of the body. The direction of the velocity vector is always the direction in which the object is moving at that instant.
- Acceleration (a): This vector quantity describes the rate of change of velocity. It indicates how the velocity is changing (getting faster, slower, or turning), but not necessarily the direction the body is currently moving.
Example: Imagine you throw a ball straight up.
- Going Up: The velocity is directed upward (direction of motion). The acceleration (due to gravity) is directed downward.
- At the Peak: The instantaneous velocity is zero (the body stops moving for a moment). The acceleration is still directed downward.
- Coming Down: The velocity is directed downward (direction of motion). The acceleration is also directed downward.
Question 24.
(a) Give one example of following motion : Uniform velocity
(b) Give one example of following motion : Variable velocity
(c) Give one example of following motion : Variable acceleration
(d) Give one example of the following motion: Uniform retardation
Ans:
| Motion Type | Example |
| (a) Uniform Velocity | A train moving along a straight, level track at a constant speed, such as 80 km/h without changing its direction. |
| (b) Variable Velocity | A car driving around a circular racetrack at a constant speed of 100 km/h. The car’s speed is constant, but its direction (and thus its velocity) is continuously changing. |
| (c) Variable Acceleration | A rocket launching into space where its engine thrust (force) and the amount of fuel remaining (mass) constantly change. Since acceleration (a) is defined by Force/Mass, both the magnitude and direction of its acceleration vary significantly over time. |
| (d) Uniform Retardation | A skater gliding across a horizontal, rough ice rink who initially pushes off and then glides to a stop. The force of friction is nearly constant and acts opposite to the direction of motion, causing a uniform decrease in velocity (constant negative acceleration). |
Question 25.
The diagram below shows the pattern of the oil on the road at a constant rate from a moving car. What information do you get from it about the motion of the car?
Ans:
The information you get about the motion of the car depends entirely on the spacing of the oil drops.
Since the oil is dripping at a constant rate, the time interval between any two consecutive drops is always the same (e.g., one drop every second). Therefore, the distance between the drops directly indicates the speed of the car during that time interval.
Based on the general interpretation of oil drop patterns:
- If the drops are equally spaced (Constant distance between drops):
- The car is covering equal distances in equal intervals of time.
- This indicates the car is moving with Uniform Velocity (constant speed).
- If the distance between the drops is increasing:
- The car is covering increasing distances in equal intervals of time.
- This indicates the car is accelerating (speeding up).
- If the distance between the drops is decreasing:
- The car is covering decreasing distances in equal intervals of time.
- This indicates the car is decelerating (slowing down).
In the specific image provided in the context (which is not visible to me but is a common exam question):
- The usual pattern shown in this context is a combination: Equally spaced drops followed by drops that are closer together.
If the pattern shows initial uniform spacing followed by decreasing spacing, the information is:
- The car initially moved with a constant speed (uniform velocity) and then slowed down (deceleration/non-uniform motion).
Question 26.
Define the term acceleration due to gravity. State its average value.
Ans:
Acceleration Due to Gravity (g)
Acceleration due to gravity is the constant acceleration experienced by a body in free fall (i.e., moving solely under the influence of gravity) towards the center of a massive object, such as a planet.
It is denoted by the letter g and represents the rate at which the velocity of a freely falling object increases every second. Crucially, it is independent of the mass of the falling object (ignoring air resistance).
Average Value
The standard, or average, value of acceleration due to gravity on the surface of the Earth is approximately:
g≈9.8 m/s2
This is often used for calculations near the Earth’s surface. The precise value varies slightly with factors like altitude, latitude (being slightly greater at the poles than at the equator), and local geology.
Question 27.
‘The value of g remains the same at all places on the Earth’s surface’. Is this statement true? Give reason for your answer.
Ans:
Reason for Variation in g
The acceleration due to gravity (g) varies slightly across the Earth’s surface due to two main factors: the shape of the Earth and its rotation.
1. Earth’s Shape (Latitude)
The formula for acceleration due to gravity is g=R2GM, where R is the radius from the center of the Earth.
- The Earth is not a perfect sphere; it is an oblate spheroid, meaning it’s slightly flattened at the poles and bulges at the equator.
- The equatorial radius (Re) is greater than the polar radius (Rp).
- Since g is inversely proportional to R2, a larger radius results in a smaller value of g.
- Therefore, g is minimum at the Equator (largest radius).
- g is maximum at the Poles (smallest radius).
2. Earth’s Rotation
- The rotation of the Earth creates an outward centrifugal force that partially counteracts the gravitational pull.
- This centrifugal effect is maximum at the Equator (where the rotational speed is highest) and zero at the Poles.
- This outward force reduces the effective value of g most significantly at the equator, contributing to its minimum value there.
For these reasons, the value of g ranges from approximately 9.78 m/s2 at the equator to 9.83 m/s2 at the poles. The conventional average value used in calculations is 9.8 m/s2.
Question 28.
If a stone and a pencil are dropped simultaneously in vacuum from the top of a tower, then which of the two will reach the ground first? Give a reason.
Ans:
Reason
The reason is that in a vacuum, the only force acting on both objects is gravity.
- Acceleration is Independent of Mass: Near the Earth’s surface, the acceleration due to gravity (g) is constant for all objects, approximately 9.8 m/s2. This acceleration is independent of an object’s mass.
- No Air Resistance: The term “in a vacuum” means there is absolutely no air resistance or drag force to oppose the motion.
- Conclusion: Since both the heavy stone and the light pencil start from rest, fall through the same distance, and experience the exact same downward acceleration (g), their velocities and the time taken to reach the ground must be equal.
Exercise 2 (A)
Question 1.
The vector quantity is :
- Work
- Pressure
- Distance
- Velocity
Ans: Velocity is a Vector quantity. The others are all Scalar quantities.
Question 2.
The S.I. unit of velocity is ___________
- km h-1
- m min-1
- km rnin-1
- m s-1
Question 3.
The unit of retardation is ____________
- m s-1
- m s-2
- m
- m s2
Question 4.
A body when projected up with an initial velocity u goes to a maximum height h in time t and then comes back at the point of projection. The correct statement is ______________
- The average velocity is 2 h/t.
- The acceleration is zero.
- The final velocity on reaching the point of projection is 2 u.
- The displacement is zero.
Question 5.
18 km h-1 is equal to _____________
- 10 m s-1
- 5 m s-1
- 18 m s-1
- 1.8 m s-1
Exercise 2 (A)
Question 1.
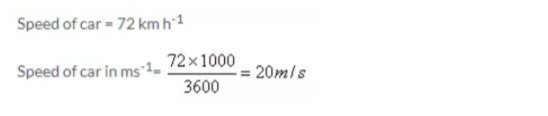
The speed of a car is 72 km h-1. Express it in m s-1.
Ans:
Question 2.
Express 15 m s-1 in km h-1.
Ans:
Question 3.
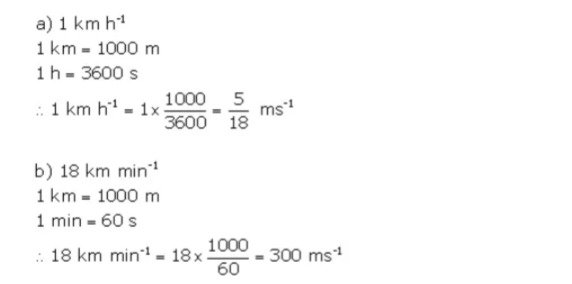
(a) Express the following in m s−1. 1 km h−1
(b) Express the following in m s-1. 18 km min-1
Ans:
Question 4.
Arrange the following speeds in increasing order. 10 m s-1, 1 km min-1 and 18 km h-1.
Ans:
18 km h−1<10 m s−1<1 km min−1
Question 5.
A train takes 3 h to travel from Agra to Delhi with a uniform speed of 65 km h-1. Find the distance between the two cities.
Ans:
Calculation
This is a straightforward application of the distance, speed, and time relationship.
The formula relating distance (D), speed (S), and time (T) is:
Distance = Speed × Time
Given:
- Speed (S) = 65 km h−1
- Time (T) = 3 h
Substituting the values into the formula:
D=65 km h−1×3 h
D=195 km
Question 6.
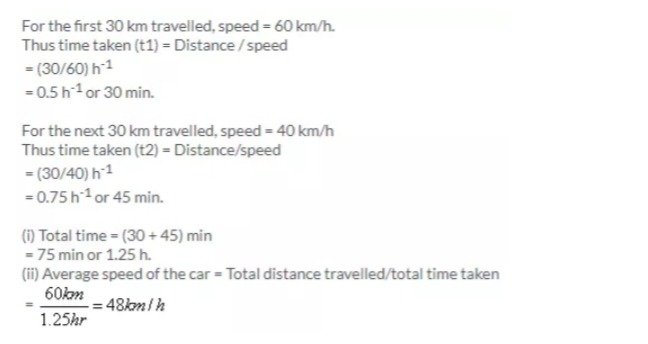
A car travels the first 30 km with a uniform speed of 60 km h−1 and the next 30 km with a uniform speed of 40 km h−1. Calculate :
The total time of journey,
The average speed of the car.
Ans:
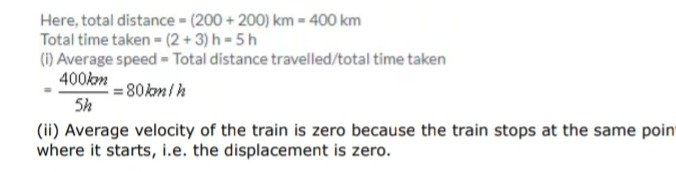
Question 7.
A train takes 2 h to reach station B from station A, and then 3 h to return from station B to station A. The distance between the two stations is 200 km. Find:
The average speed,
The average velocity of the train.
Ans:
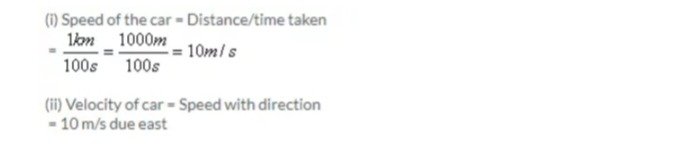
Question 8.
( a) A car moving on a straight path covers a distance of 1 km due east in 100 s. What is the speed of the car?
(d) A car moving on a straight path covers a distance of 1 km due east in 100 s. What is the velocity of the car?
Ans:
Question 9.
A body starts from rest and acquires a velocity 10 m s-1 in 2 s. Find the acceleration.
10. A car starting from rest acquires a velocity 180m s-1 in 0.05 h. Find the acceleration.
Ans:
Final Answers:
- 5 m/s2
- 1 m/s2
Question 11.
A body is moving vertically upwards. Its velocity changes at a constant rate from 50 m s−1 to 20 m s−1 in 3 s. What is its acceleration?
Ans:
Analysis of the Calculation
The problem asks for the acceleration (a) of a body whose velocity changes from an initial value (u) to a final value (v) over a time interval (t).
The formula used is the definition of acceleration:
A = Time Taken / Change in Velocity =t / v−u
Step-by-Step Breakdown
- Identify Variables (with upwards as positive):
- Initial Velocity (u): +50 m/s
- Final Velocity (v): +20 m/s
- Time (t): 3 s
- Calculate Acceleration:
a=3 s / (20 m/s)−(50 m/s)
a=3 s / −30 m/s
a=−10.0 m/s2
Conclusion
The body’s acceleration is −10.0 m/s2.
This result means:
- The body is decelerating (slowing down) at a rate of 10.0 m/s every second.
- The acceleration vector points downwards (↓), which is physically expected for a body moving vertically near the Earth’s surface under the influence of gravity (g≈9.8 to 10 m/s2).
Question 12.
A toy car initially moving with uniform velocity of 18 km h-1 comes to a stop in 2 s. Find the retardation of the car in S.I. units.
Ans:
Retardation=∣a∣=∣−2.5 m/s2∣=2.5 m/s2
Question 13.
A car accelerates at a rate of 5 m s-2. Find the increase in its velocity in 2 s.
Ans:
Calculation
The increase in velocity (Δv) is the change in velocity, which is related to acceleration (a) and time (t) by the definition of acceleration:
a=tΔv
Therefore, the increase in velocity is:
Δv=a×t
Given Values:
- Acceleration (a) = 5 m/s2
- Time (t) = 2 s
Substitute the values:
Δv=5 m/s2×2 s
Δv=10 m/s
The velocity will increase by 10 m/s.
Question 14.
A car is moving with a velocity 20 m s-1. The brakes are applied to retard it at a rate of 2 m s-2. What will be the velocity after 5 s of applying the brakes?
Ans:
Calculation
This problem involves uniformly accelerated (or retarded) motion, which can be solved using the first equation of motion:
v=u+at
Given values:
- Initial velocity (u): 20 m/s
- Time (t): 5 s
- Retardation (deceleration, a): 2 m/s2
Since the car is retarding (slowing down), the acceleration must be taken as negative in the equation: a=−2 m/s2.
Substitute the values into the equation:
vvv=20 m/s+(−2 m/s2)×5 s=20 m/s−10 m/s=10 m/s
The final velocity (v) of the car after 5 s is 10 m/s.
Question 15.
A bicycle initially moving with a velocity 5.0 m s-1 accelerates for 5 s at a rate of 2 m s-2. What will be its final velocity?
Ans:
Calculation of Final Velocity
This is a problem of uniformly accelerated motion, which can be solved using the first equation of motion:
v=u+at
Given Values:
- Initial velocity (u) = 5.0 m/s
- Acceleration (a) = 2 m/s2
- Time (t) = 5 s
- Final velocity (v) = ?
Substitute the values:
v=5.0 m/s+(2 m/s2×5 s)
v=5.0 m/s+10 m/s
v=15.0 m/s
The final velocity of the bicycle is 15.0 m/s.
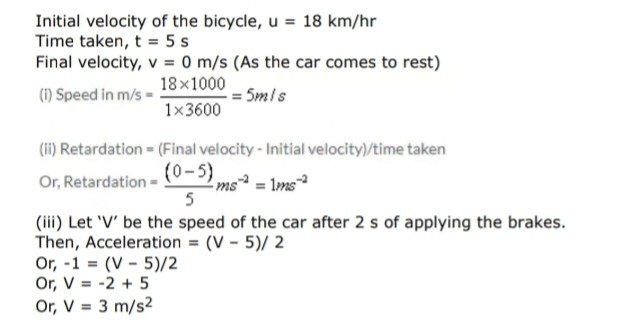
16. A car is moving in a straight line with speed 18 km h-1. It is stopped in 5 s by applying the brakes. Find:
the speed of car in m s-1
the retardation and
the speed of the car after 2 s of applying the brakes.
Ans:
Exercise 2 (B)
Question 1.
For the motion with uniform velocity , how is the distance travelled related to the time ?
Ans:
When velocity (v) is uniform (constant speed and direction), the distance (d) covered is directly proportional to the time (t) elapsed.
This is expressed by the linear equation:
d=v×t
Key Consequences
- Scaling: If the time taken is scaled by any factor, the distance traveled is scaled by the same factor (e.g., doubling the time doubles the distance).
- Graphical Representation: On a distance-time graph, this motion appears as a straight line with a constant, positive slope, signifying that the object covers equal distances in equal time intervals.
Question 2.
What information about the motion of a body are obtained from the displacement-time graph?
Ans:
A displacement-time graph provides crucial information about a body’s velocity and the nature of its motion. The most important insight is derived from the slope (or gradient) of the line: the slope is equal to the object’s instantaneous velocity (velocity=change in time / change in displacement). A steeper slope indicates a greater speed, while a horizontal line (zero slope) shows the object is stationary (zero velocity). A positive slope means the object is moving in the positive direction, and a negative slope indicates movement in the negative (or opposite) direction. The y-intercept of the graph gives the body’s initial displacement.
The graph’s shape reveals the type of motion. A straight, diagonal line indicates uniform motion because the slope (velocity) is constant. Conversely, a curved line signifies non-uniform motion, where the velocity is changing, meaning the object is accelerating or decelerating. Specifically, a curve that gets steeper indicates increasing velocity (acceleration), and one that flattens indicates decreasing velocity (deceleration). By analyzing the graph, one can determine when the body is at rest, moving forward, moving backward, or changing its rate of movement.
Question 3.
(a) What does the slope of a displacement-time graph represent?
(b) Can displacement-time sketch be parallel to the displacement axis? Give a reason to your answer.
Ans:
(a) The slope of a displacement-time graph represents the velocity of the object.
Slope=ΔTimeΔDisplacement=Velocity
The slope indicates how quickly the displacement is changing with respect to time.
(b) No, a displacement-time graph cannot be parallel to the displacement axis.
A line parallel to the displacement axis (the vertical axis) would mean that the displacement is changing while the time remains constant. This would imply that the object is at multiple different positions at the exact same instant in time, which is physically impossible. In other words, for an infinitesimally small change in time (Δt→0), the object would have an infinite velocity (v=Δx/Δt→∞).
Question 4.
Draw a displacement-time graph for a boy going to school with uniform velocity.
Ans:
Here’s a displacement-time graph for a boy going to school with uniform velocity:
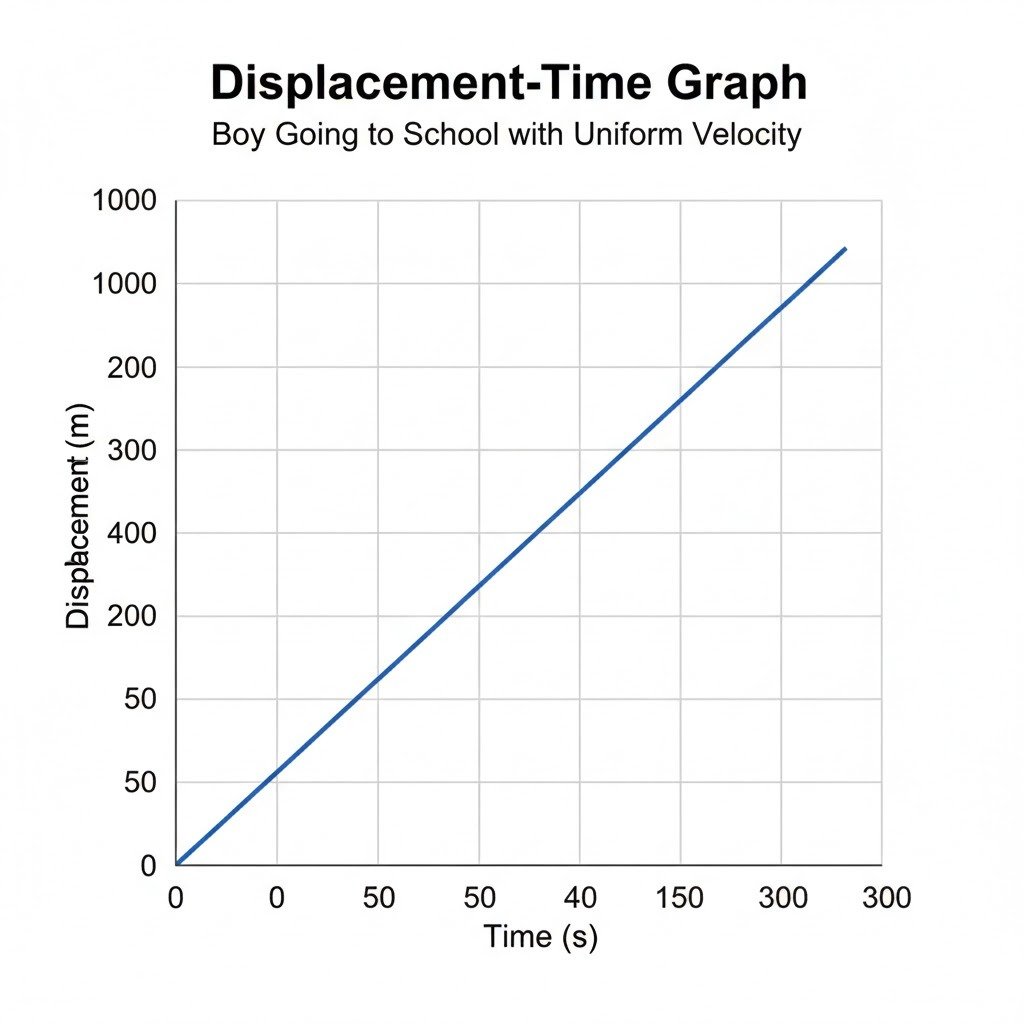
On this graph:
- The x-axis (Time) represents the time elapsed in seconds (s).
- The y-axis (Displacement) represents the boy’s displacement from his starting point (home) in meters (m).
- The straight line with a positive slope indicates that the boy is moving with a uniform velocity. This means he covers equal distances in equal intervals of time.
- The graph starts at the origin (0,0), signifying that at time t=0, the boy’s displacement is 0 (he is at home).
Question 5.
(a) State how the velocity-time graph can be used to find The acceleration of a body
(b) State how the velocity-time graph can be used to find The distance travelled by the body in a given time
(c) State how the velocity-time graph can be used to find The displacement of the body in a given time.
Ans:
Acceleration
The acceleration of a body is determined by the gradient (slope) of the velocity-time graph.
A = Change in Time / Change in Velocity
- Constant acceleration is shown by a straight-line segment.
- Varying acceleration is indicated by a curved-line segment.
Distance Travelled
The total distance travelled is found by calculating the total area under the graph for the specified time interval. Since distance is a scalar, all area, whether above or below the time axis (representing motion in opposite directions), is counted as positive.
Displacement
The displacement is the net area under the graph. As a vector quantity, area above the time axis (positive velocity) is treated as positive, and area below the time axis (negative velocity) is treated as negative.
Displacement=(Area above axis)−(Area below axis)
Question 6.
(a) What can you say about the nature of motion of a body if its displacement-time graph is a straight line parallel to the time axis?
(b) What can you say about the nature of motion of a body if its displacement-time graph is a straight line inclined to the time axis with an acute angle?
(c) What can you say about the nature of motion of a body if its displacement-time graph is a straight line inclined to the time axis with an obtuse angle?
(d) What can you say about the nature of motion of a body if its displacement-time graph is A curve.
Ans:
The nature of a body’s motion can be determined by analyzing the slope and shape of its displacement-time (s−t) graph.
(a) Straight Line Parallel to Time Axis
If the displacement-time graph is a straight line parallel to the time axis, it means the displacement (s) is constant and does not change with time (t).
- Nature of Motion: The body is at rest (stationary).
- Reasoning: The slope of the s−t graph represents velocity (v=Δs/Δt). A horizontal line has a zero slope, meaning the velocity is zero (v=0). The body’s position is fixed.
(b) Straight Line Inclined with an Acute Angle
If the displacement-time graph is a straight line inclined to the time axis with an acute angle (positive slope), it means the displacement is increasing linearly with time.
- Nature of Motion: The body is moving with uniform positive velocity (constant speed in a constant direction).
- Reasoning: A straight, inclined line indicates a constant, non-zero slope. Since the slope is positive (acute angle), the velocity is constant and positive. This is uniform motion.
(c) Straight Line Inclined with an Obtuse Angle
If the displacement-time graph is a straight line inclined to the time axis with an obtuse angle (negative slope), it means the displacement is decreasing linearly with time (i.e., the body is moving back towards its starting point or a less positive displacement).
- Nature of Motion: The body is moving with uniform negative velocity (constant speed, but in the opposite direction to the defined positive direction).
- Reasoning: A straight, inclined line indicates a constant, non-zero slope. Since the slope is negative (obtuse angle), the velocity is constant and negative. This is also uniform motion, but in the reverse direction.
(d) A Curve
If the displacement-time graph is a curve (not a straight line), it means the slope (velocity) is changing over time.
- Nature of Motion: The body is undergoing non-uniform motion or accelerated motion.
- Reasoning: The slope of the tangent to the curve at any point represents the instantaneous velocity. Since the slope changes as time progresses, the velocity is not constant, meaning the body is accelerating (or decelerating).
Question 7.
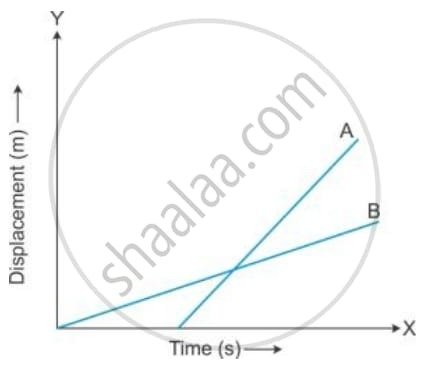
Figure shows the displacement-time graph of two vehicles A and B moving along a straight road. Which vehicle is moving faster? Give a reason.
Ans:
The vehicle that is moving faster is the one whose displacement-time graph has a greater slope.
- Vehicle A is moving faster.
Reason
The slope of a displacement-time (s−t) graph represents the velocity of the body (Velocity=Slope=Change in TimeChange in Displacement).
- Both graphs (A and B) are straight lines, indicating that both vehicles are moving with uniform (constant) velocity.
- By visually comparing the two lines, line A is steeper than line B.
- A steeper slope means a greater change in displacement for the same change in time, hence a higher velocity.
Since Slope of A > Slope of B, it follows that Velocity of A > Velocity of B. Therefore, Vehicle A is moving faster.
Question 8.
State the type of motion represented by the following sketches in Figures.
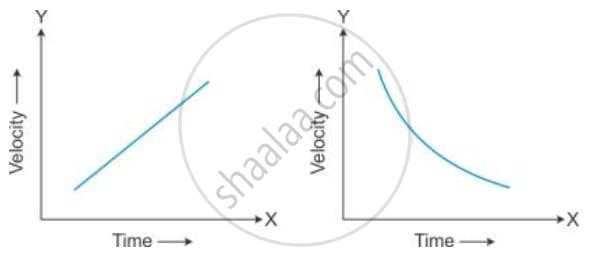
Give an example of each type of motion.
Ans:
The provided image contains two separate graphs with Velocity on the Y-axis and Time on the X-axis.
Analysis of Motion
Figure 1 (Left Sketch)
The graph on the left shows a straight line with a positive slope (gradient).
- Type of Motion: Uniformly Accelerated Motion (or motion with constant positive acceleration).
- Reason: The line is straight, indicating that the velocity is changing by an equal amount in equal intervals of time. The slope of a velocity-time graph represents acceleration (Acceleration=ΔTime / ΔVelocity). A straight line with a constant slope means the acceleration is constant and non-zero.
- Example: A ball rolling down an inclined plane or a body falling freely under gravity (neglecting air resistance).
Figure 2 (Right Sketch)
The graph on the right shows a curved line where the velocity is decreasing as time progresses. The curve gets less steep over time, meaning the magnitude of the slope is decreasing.
- Type of Motion: Non-Uniformly Decelerated Motion (or motion with varying negative acceleration, often called varying retardation).
- Reason: The line is a curve, indicating that the velocity is not changing by an equal amount in equal intervals of time. Since the slope (acceleration) is negative and its magnitude is decreasing, the object is slowing down (decelerating), but the rate at which it is slowing down is decreasing.
- Example: A vehicle that is slowing down to stop where the driver gradually eases off the brakes or a spacecraft re-entering the atmosphere and gradually decreasing its rate of deceleration as it loses speed.
Question 9.
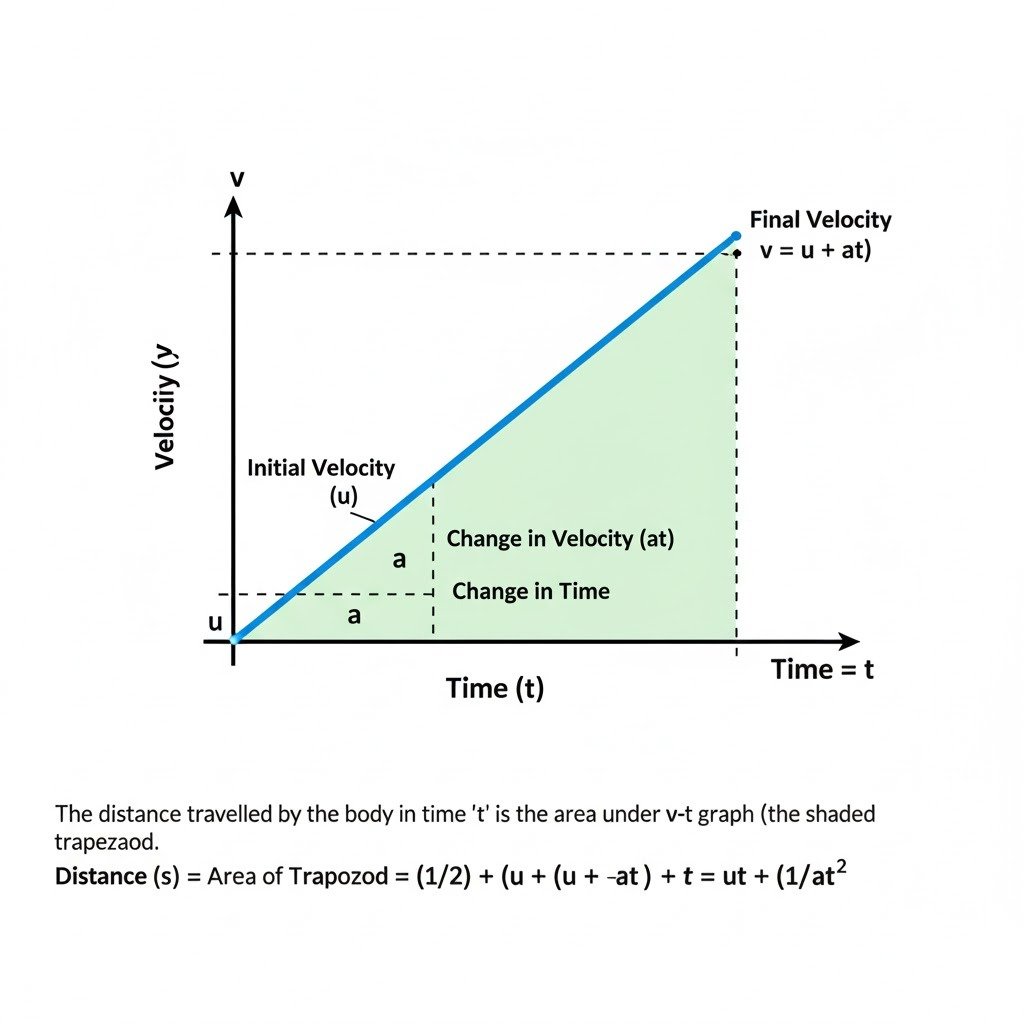
Draw a velocity-time graph for a body moving with an initial velocity u and uniform acceleration a. Use this graph to find the distance travelled by the body in time t.
Ans:
Here’s the graph representing a body moving with an initial velocity ‘u’ and uniform acceleration ‘a’.
Now, let’s use this graph to find the distance traveled by the body in time ‘t’.
Finding the Distance Traveled from the Velocity-Time Graph:
The distance traveled by a body is represented by the area under its velocity-time graph.
In the graph above:
- Initial Velocity: At time t=0, the velocity is u.
- Uniform Acceleration: The straight line with a positive slope indicates uniform acceleration ‘a’.
- Final Velocity: At time t, the velocity ‘v’ can be found using the first equation of motion: v = u + at.
The shape under the graph, up to time ‘t’, is a trapezoid (or a combination of a rectangle and a triangle).
Method 1: Area of the Trapezoid
The area of a trapezoid is given by: Area = (1/2) * (Sum of parallel sides) * (Height)
- Parallel sides are the initial velocity (u) and the final velocity (v = u + at).
- The height of the trapezoid is the time ‘t’.
Distance (s) = (1/2) * (u + v) * t
Substitute v = u + at: s = (1/2) * (u + (u + at)) * t
s = (1/2) * (2u + at) * t
s = (1/2) * (2ut + at²)
s = ut + (1/2)at²
Method 2: Area of Rectangle + Area of Triangle
- Area of Rectangle: This represents the distance if the body moved with constant initial velocity ‘u’. Area_rectangle = base * height = t * u = ut
- Area of Triangle: This represents the additional distance due to acceleration. The base of the triangle is ‘t’. The height of the triangle is the change in velocity = final velocity – initial velocity = (u + at) – u = at. Area_triangle = (1/2) * base * height = (1/2) * t * (at) = (1/2)at²
- Total Distance: s = Area_rectangle + Area_triangle
- s = ut + (1/2)at²
Question 10.
What does the slope of the velocity-time graph represent?
Ans:
The slope of the velocity-time graph represents the acceleration of the body.
Explanation
The slope (or gradient) of any graph is defined as the change in the quantity on the vertical (y) axis divided by the change in the quantity on the horizontal (x) axis.
For a velocity-time graph:
Slope=Change in Time (horizontal axis) / Change in Velocity (vertical axis)=Δt / Δv
By definition, the rate of change of velocity with respect to time is acceleration (a):
a=tf−ti / vf−vi=Δt / Δv
Therefore, the slope of a velocity-time graph is equal to the acceleration of the moving body.
- A positive slope indicates positive acceleration (speeding up).
- A negative slope indicates negative acceleration or deceleration/retardation (slowing down).
- A zero slope (a horizontal line) indicates zero acceleration, meaning the body is moving with constant velocity.
Question 11.
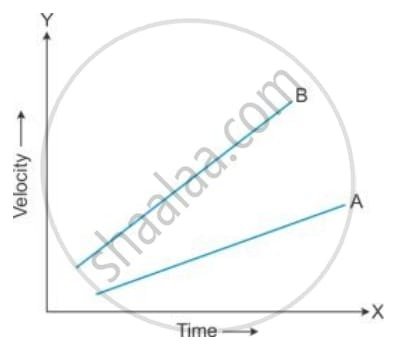
Figure shows the velocity-time graphs for two cars A and B moving in the same direction. Which car has greater acceleration? Give reasons to your answer.
Ans:
- Query successful
Based on the velocity-time graph provided, Car B has greater acceleration.
Reason
The acceleration of a body in a velocity-time graph is represented by the slope (or gradient) of the line.
Acceleration=Slope=ΔTime / ΔVelocity
- Comparing Slopes: By visually inspecting the graph, the line for Car B is steeper than the line for Car A.
- Conclusion: A steeper slope indicates a larger value for the rate of change of velocity, which means greater acceleration. Therefore, Car B is changing its velocity more rapidly than Car A.
Question 12.
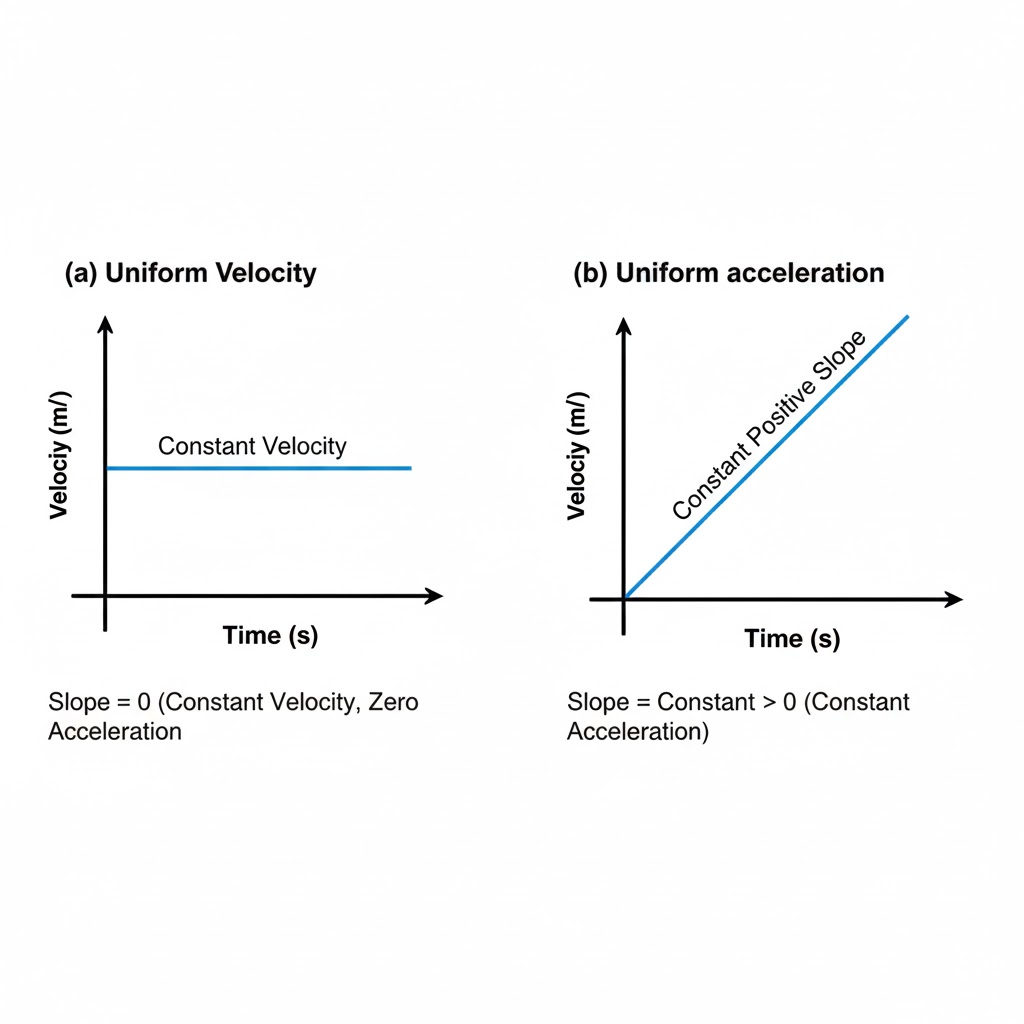
Draw the shape of the velocity-time graph for a body moving with
(a) Uniform velocity and (b) Uniform acceleration.
Ans:
Question 13.
The velocity-time graph for a uniformly retarded body is a straight line inclined to the time axis with an obtuse angle. How is retardation calculated from the velocity-time graph?
Ans:
The retardation of a body from a velocity-time graph is calculated by finding the magnitude of the negative slope of the straight line.
Calculation of Retardation
The fundamental principle is that the slope of a velocity-time graph represents the acceleration (a).
Acceleration (a)=Slope=Change in Time / Change in Velocity= tf−ti / vf−vi
For uniformly retarded motion:
- Velocity Change: The velocity is decreasing, meaning the final velocity (vf) is less than the initial velocity (vi).
- Negative Slope: The change in velocity (Δv=vf−vi) will be negative, resulting in a negative acceleration (the slope of the line is negative and forms an obtuse angle with the time axis).
- Retardation Definition: Retardation is defined as the magnitude of this negative acceleration.
Formula for Retardation
To calculate the retardation (R):
R=∣Acceleration∣=∣a∣
R=|vf-vi / tf-ti| or R= vi-vf / tf-ti
Where:
- vi is the initial velocity (higher velocity).
- vf is the final velocity (lower velocity).
- ti is the initial time.
- tf is the final time.
Question 14.
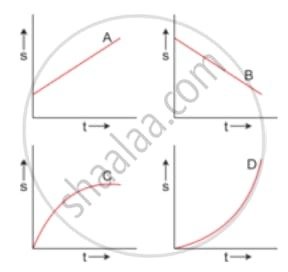
The figure shows the displacement – time graph for four bodies A, B C and D. In each case state what information do you get about the acceleration (zero, positive or negative).
Ans:
To determine the acceleration from a displacement-time (s−t) graph, you must first analyze the slope of the graph, which represents the velocity (v). Then, you determine how the velocity is changing over time.
- Zero Acceleration: Velocity is constant (straight line).
- Positive Acceleration: Velocity is increasing (slope is getting steeper).
- Negative Acceleration: Velocity is decreasing (slope is getting flatter).
Analysis of Each Graph
Graph A
- Shape: Straight line with a positive slope (inclined with an acute angle).
- Velocity: The slope is constant and positive (uniform positive velocity).
- Acceleration: Zero. Since the velocity is constant, the rate of change of velocity (acceleration) is zero (a=0).
Graph B
- Shape: Straight line with a negative slope (inclined with an obtuse angle).
- Velocity: The slope is constant and negative (uniform negative velocity).
- Acceleration: Zero. Since the velocity is constant, the acceleration is zero (a=0). The body is moving in the negative direction at a steady speed.
Graph C
- Shape: A curve where the slope is decreasing (getting flatter) as time increases.
- Velocity: The instantaneous velocity is decreasing over time, but is still positive.
- Acceleration: Negative. A decreasing velocity means the body is decelerating (or has negative acceleration)
Graph D
- Shape: A curve where the slope is increasing (getting steeper) as time increases.
- Velocity: The instantaneous velocity is increasing over time.
- Acceleration: Positive. An increasing velocity means the body is accelerating in the positive direction.
Question 15.
Draw a graph for acceleration against time for a uniformly accelerated motion. How can it be used to find the change in speed in a certain interval of time?
Ans:
Acceleration-Time Graph for Uniformly Accelerated Motion
For a uniformly accelerated motion, the acceleration is constant (not changing) over time.
This is represented on an acceleration-time graph by a straight horizontal line parallel to the time axis.
Finding Change in Speed
The change in speed (or velocity) in a certain interval of time from an acceleration-time graph is found by calculating the area under the graph for that interval.
Mathematical Reason
The definition of acceleration (a) is:
a=ΔtΔv
Rearranging this equation to solve for the change in velocity (Δv):
Δv=a×Δt
Graphical Calculation
In the acceleration-time graph for a uniform acceleration a:
- Select Time Interval: Consider a time interval from t1 to t2, so Δt=t2−t1.
- Calculate Area: The area under the graph between t1 and t2 is a rectangle.
Area=Height×Base
Area=a×(t2−t1)
Since Δv=a×Δt, the area under the acceleration-time graph is equal to the change in speed during that time interval:
Change in Speed (Δv)=Area under the a-t graph
Question 16.
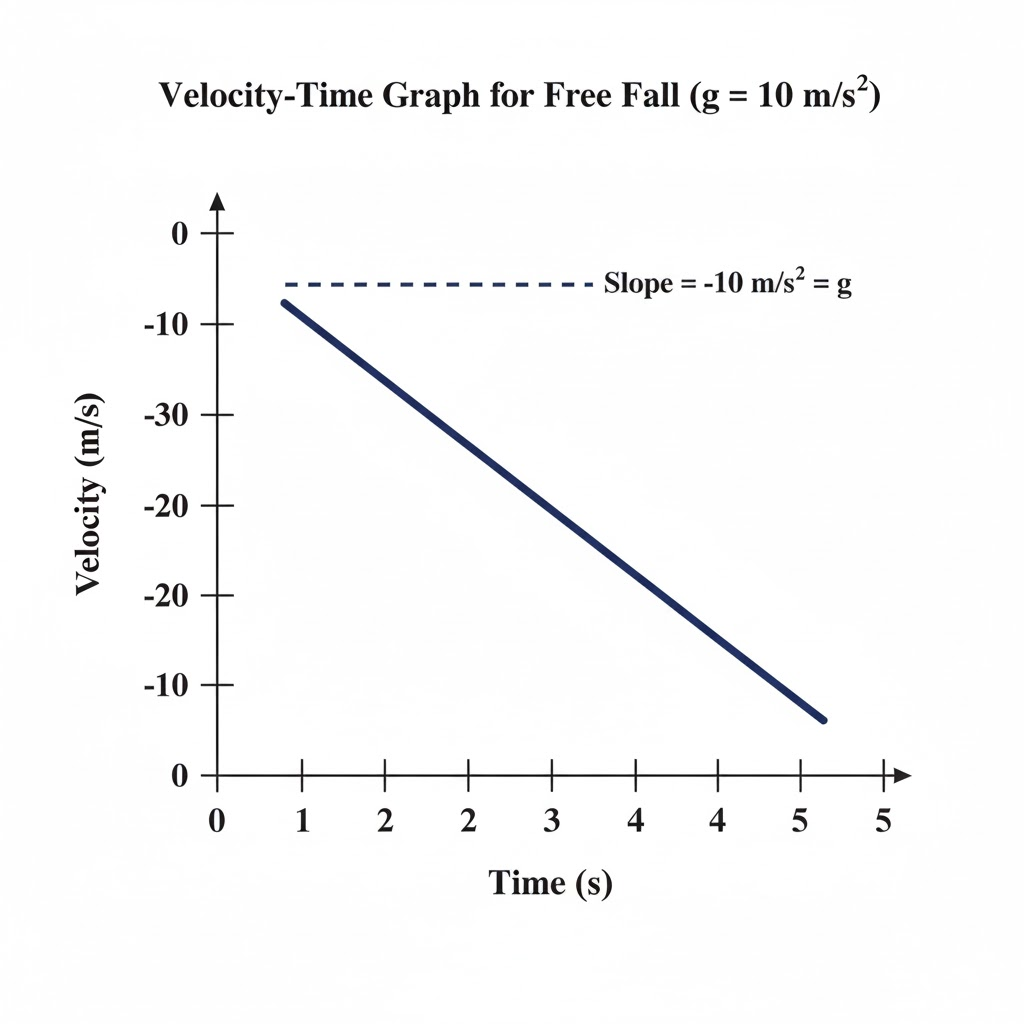
Draw a velocity-time graph for the free fall of a body under gravity starting from rest. Take g = 10m s-2
Ans:
Question 17.
How is the distance related with time for motion under uniform acceleration such as the motion of a freely falling body?
Ans:
1. The Governing Equation (Second Equation of Motion)
The general kinematic equation that relates displacement (distance in straight-line motion), time, initial velocity, and uniform acceleration is:
s=ut+21at2
Where:
- s = Distance/Displacement travelled.
- u = Initial velocity.
- a = Uniform acceleration (constant).
- t = Time elapsed.
2. Application to a Freely Falling Body (Starting from Rest)
For a body that is freely falling and starts from rest, the initial conditions are:
- Initial Velocity (u): u=0
- Uniform Acceleration (a): a=g (acceleration due to gravity, which is constant near the Earth’s surface)
Substituting these values into the general equation:
s=(0)t+2 / 1gt2
s=2 / 1gt2
Key Relationship
Since 21 and g are constants, the distance (s) is directly proportional to the square of the time (t2):
s∝t2
This means:
- After 1 second, the body has fallen a distance proportional to 12=1 unit.
- After 2 seconds, the body has fallen a distance proportional to 22=4 units.
- After 3 seconds, the body has fallen a distance proportional to 32=9 units.
Question 18.
A body falls freely from a certain height. Show graphically the relation between the distance fallen and square of time. How will you determine g from this graph?
Ans:
Graph: Distance Fallen vs. Square of Time
For a body falling freely from rest, the distance fallen (s) is given by:
s=21gt2
This equation is in the form of y=mx, where y=s, x=t2, and the slope m=21g.
So, plotting distance fallen (s) on the Y-axis against the square of time (t2) on the X-axis will yield a straight line passing through the origin.
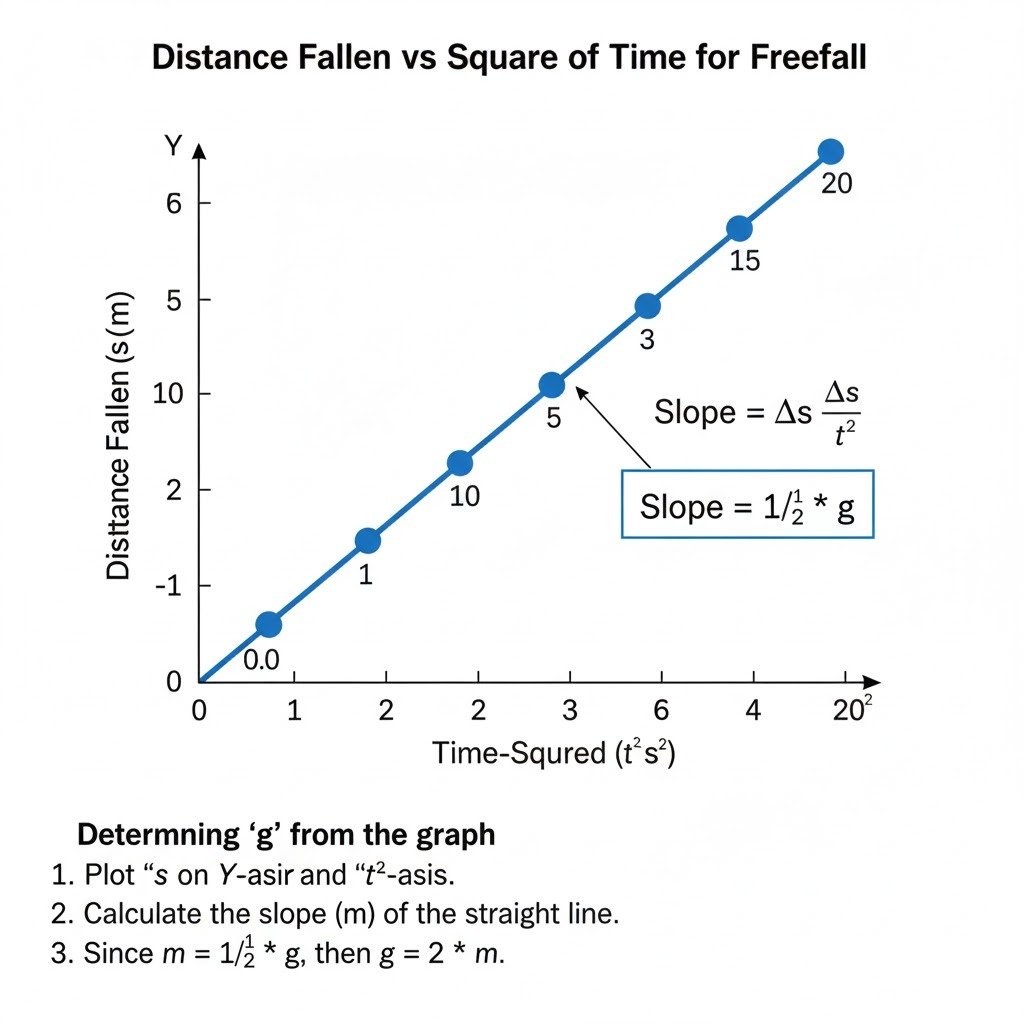
Determining ‘g’ from the Graph (in short)
- Plot the Graph: Plot distance fallen (s) on the Y-axis and the square of time (t2) on the X-axis.
- Calculate Slope: The graph will be a straight line passing through the origin. Calculate the slope (m) of this straight line.
m=Δ(t2) / Δs - Determine ‘g’: From the equation s=2 / 1gt2, we know that the slope of the s vs. t2 graph is equal to 2 / 1g. Therefore,
m=2 /1g
∗∗g=2m∗∗
Exercise 2 (B)
Question 1.
The velocity-time graph of a body in motion is a straight line inclined to the time axis. The correct statement is ___________
- Velocity is uniform
- Acceleration is uniform
- Both velocity and acceleration are uniform
- Neither velocity nor acceleration is uniform.
Question 2.
For a uniformly retarded motion, the velocity-time graph is _____________
- A curve
- A straight line parallel to the time axis
- A straight line perpendicular to the time axis
- A straight line inclined to the time axis
Question 3.
For uniform motion _________
- The distance-time graph is a straight line parallel to the time axis.
- The speed-time graph is a straight line inclined to the time axis.
- The speed-time graph is a straight line parallel to the time axis.
- The acceleration-time graph is a straight line parallel to the time axis.
Exercise 2 (B)
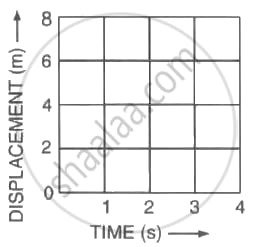
Question 1.
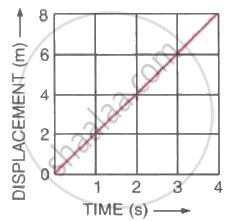
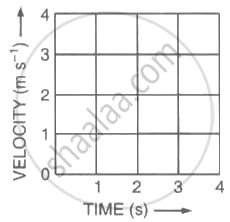
Figure (a) shows the displacement-time graph for the motion of a body. Use it to calculate the velocity of the body at t = 1 s, 2 s and 3 s, and then draw the velocity-time graph in Figure (b) for it.
(a)
(b)
Ans:
1. Calculation of Velocity
We can use any two points on the line in the graph (pp6.jpg) to calculate the constant velocity.
Let’s use the origin (t1,s1)=(0 s,0 m) and the point (t2,s2)=(2 s,4 m).
Velocity (v)=Slope=t2−t1s2−s1
v=2 s−0 s4 m−0 m=2 s4 m=2 m/s
Since the motion is uniform (constant velocity), the velocity is the same at all specified times:
| Time (t) | Velocity (v) |
| t=1 s | 2 m/s |
| t=2 s | 2 m/s |
| t=3 s | 2 m/s |
2. Velocity-Time Graph (Figure b)
Since the velocity is constant at 2 m/s for the entire duration, the velocity-time (v−t) graph is a straight line parallel to the time axis at a velocity value of 2 m/s.
Question 2.
The following table gives the displacement of a car at different instants of time.
| Time (s) | 0 | 1 | 2 | 3 | 4 |
| Displacement (m) | 0 | 5 | 10 | 15 | 20 |
Draw the displacement-time sketch and find the average velocity of the car.
What will be the displacement of the car at (i) 2.5 s and (ii) 4.5 s?
Ans:
1. Figuring Out the Car’s Speed
By looking at the data, we can see the car covers the same amount of ground in each matching period of time. This is the classic signature of motion at a constant speed; the car isn’t speeding up or slowing down.
To find this steady speed, we take the entire journey’s displacement and divide it by the total time it took for the trip.
- The car moved a total of 20 meters.
- This journey took a total of 4 seconds.
So, the calculation for speed is:
Speed = 20 meters / 4 seconds = 5 meters per second.
Because the speed is perfectly constant, the car’s speed at any single moment (its instantaneous velocity) is identical to its overall average speed: 5 m/s.
2. What the Distance-Time Graph Looks Like
When an object moves like this, with a steady pace, the relationship between distance and time is perfectly linear. This means if you plot the displacement on the vertical axis and time on the horizontal axis, the points will connect to form a straight line that starts at the origin (0,0).
The most important feature of this line is its steepness, or slope. A constant slope directly represents the car’s constant velocity. In this specific case, the line will have a steady, unchanging slope of 5 meters per second. You can think of the slope as the car’s “progress per second” visualized on the graph.
3. Predicting Position at Different Moments
Since the motion is so uniform, we can easily predict where the car will be at any future time using a simple relationship: Distance traveled equals speed multiplied by time.
With our confirmed speed of 5 m/s, the formula becomes:
Displacement = 5 × time
Let’s use this to find the position at two specific instants:
- (i) After 2.5 seconds:
The car will have traveled: 5 m/s × 2.5 s = 12.5 meters. - (ii) After 4.5 seconds:
The car will have traveled: 5 m/s × 4.5 s = 22.5 meters.
Question 3.
A body is moving in a straight line and its displacement at various instants of time is given in the following table
| Time (s) | 0 | 1 | 2 | 3 | 4 | 5 | 6 | 7 |
| Displacement (m) | 2 | 6 | 12 | 12 | 12 | 18 | 22 | 24 |
Plot the displacement-time graph and calculate
(i) Total distance travelled in the interval 1 s to 5 s.
(ii) Average velocity in time interval 1 s to 5 s.
Ans:
Step 1: Plotting the Displacement-Time Graph
Let’s first understand the motion by analyzing the data:
| Time (s) | 0 | 1 | 2 | 3 | 4 | 5 | 6 | 7 |
| Displacement (m) | 2 | 6 | 12 | 12 | 12 | 18 | 22 | 24 |
Motion Analysis:
- From t=0s to t=1s: moves from 2m to 6m (4m forward)
- From t=1s to t=2s: moves from 6m to 12m (6m forward)
- From t=2s to t=4s: stays at 12m (at rest for 2 seconds)
- From t=4s to t=5s: moves from 12m to 18m (6m forward)
- From t=5s to t=6s: moves from 18m to 22m (4m forward)
- From t=6s to t=7s: moves from 22m to 24m (2m forward)
The graph would show: A line rising from (0,2) to (1,6), then rising to (2,12), then horizontal from (2,12) to (4,12), then rising to (5,18), then to (6,22), then to (7,24).
Step 2: Total Distance Travelled from t=1s to t=5s
Distance travelled is the total path length covered, regardless of direction.
From t=1s to t=5s:
- t=1s to t=2s: |12 – 6| = 6m
- t=2s to t=3s: |12 – 12| = 0m
- t=3s to t=4s: |12 – 12| = 0m
- t=4s to t=5s: |18 – 12| = 6m
Total distance travelled = 6 + 0 + 0 + 6 = 12 meters
Step 3: Average Velocity from t=1s to t=5s
Average velocity = Total displacement ÷ Total time
Displacement = Final position – Initial position
= 18m – 6m = 12m
Time interval = 5s – 1s = 4s
Average velocity = 12m ÷ 4s = 3 m/s
Final Answers:
(i) Total distance travelled from t=1s to t=5s = 12 meters
(ii) Average velocity from t=1s to t=5s = 3 m/s
Question 4.
(a) Figure shows the displacement of a body at different times .
Calculate the velocity of the body as it moves for time interval :
(i) 0 to 5 s,
(ii) 5 s to 7 s
(iii) 7 s to 9 s.

Ans:
| Time Interval | Velocity (v) | Nature of Motion |
| 0 to 5 s | 0.6 m/s | Uniform Motion (Slow) |
| 5 s to 7 s | 0 m/s | At Rest |
| 7 s to 9 s | 2 m/s | Uniform Motion (Fast) |
b) Figure shows the displacement of a body at different times .
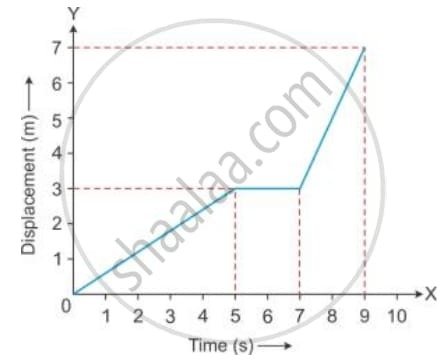
Calculate the average velocity during the time interval 5 s to 9 s ,
[Hint : From 5 s to 9 s , displacement = 7 m – 3m = 4m]
Ans:
Average Velocity Determination from Displacement-Time Data
The goal is to determine the mean rate of change of position, or average velocity (vˉ), for the body over the specified four-second interval.
The formula for average velocity is defined as the total change in displacement (Δs) divided by the duration of the time interval (Δt):
vˉ=Δt / Δs
1. Extracting Data Points
We must first establish the initial and final position and time coordinates for the segment of motion between t=5 s and t=9 s from the displacement-time plot:
- Starting Point (at tinitial=5 s): The displacement is sinitial=3 m.
- End Point (at tfinal=9 s): The displacement is sfinal=7 m.
2. Computing the Change in Parameters
Next, we compute the net displacement and the total elapsed time:
- Total Displacement (Δs): This is the change in the object’s position:
Δs=sfinal−sinitial=7 m−3 m=4 m - Time Interval (Δt): This is the duration of the motion:
Δt=tfinal−tinitial=9 s−5 s=4 s
3. Calculating Average Velocity
Finally, the average velocity is calculated by dividing the total displacement by the time interval:
vˉ=Δt / Δs= 4 s / 4 m=1 m/s
The average velocity of the body between the fifth second and the ninth second is 1 m/s. This value represents the slope of the straight line connecting the points (5 s,3 m) and (9 s,7 m) on the graph.
Question 5.
(a)From the displacement-time graph of a cyclist given below in the Figure, find The average velocity in the first 4 s.

(b) From the displacement-time graph of a cyclist given below in the Figure, find The displacement from the initial position at the end of 10 s,
(c) From the displacement-time graph of a cyclist given below in the Figure, find The time after which he reaches the starting point .

Ans:
Kinematic Analysis of a Cyclist’s Motion
The cyclist’s motion is detailed on a displacement-time graph, where the slope represents velocity. Here is the analysis for three specific questions:
(a) Average Velocity Over the First 4 Seconds
The average velocity (vˉ) is determined by finding the ratio of the total positional change (displacement, Δs) to the total time elapsed (Δt) during the period.
vˉ=Final Time−Initial TimeFinal Displacement−Initial Displacement
- Extract Coordinates
- Start of interval: ti=0 s, si=0 m (The cyclist starts from the origin).
- End of interval: tf=4 s, sf=8 m (Reading from the graph at t=4 s).
- Calculate Change in Motion Parameters
- Net Displacement (Δs): 8 m−0 m=8 m
- Duration (Δt): 4 s−0 s=4 s
- Compute Average Velocity
vˉ=4 s8 m=2 m/s
The cyclist’s mean speed in the specified direction for the first 4 seconds is 2 m/s.
(b) Displacement from the Initial Position After 10 Seconds
The displacement at a given moment is the direct value read on the vertical (displacement) axis at that point in time. It measures the net vector distance from the s=0 m origin.
- Locate Time on Axis We trace the vertical line up from t=10 s on the time axis to the plotted line.
- Read Displacement Value At t=10 s, the graph intersects the horizontal time axis (where s=0 m).
The cyclist’s displacement from the initial position at the end of 10 s is 0 m. The cyclist has returned to the starting location.
(c) Time When the Cyclist First Reaches the Starting Point
The starting point corresponds to a zero displacement (s=0 m). We are looking for the first instance after t=0 s where the graph line crosses the s=0 m line.
- Identify Zero-Displacement Crossings The graph starts at t=0 s, s=0 m. It crosses the zero displacement line later at:
- t=7 s
- t=10 s
- Determine the First Return Time The earliest time (after starting) at which the displacement is 0 m is 7 s.
Question 6.
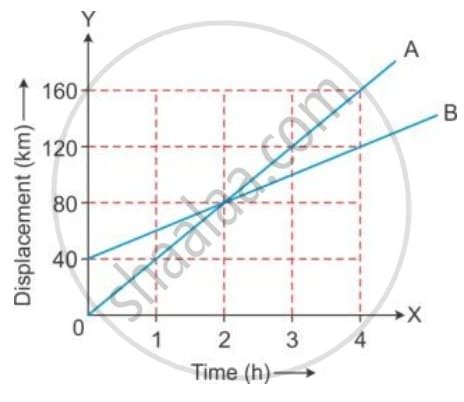
Figure ahead represents the displacement – time sketch of motion of two cars A and B Find :
(i) the distance by which car B was initially ahead of car A.
(ii) the velocities of car A and car B.
(iii) the time in which car A catches car B.
(iv) the distance from start when car A will catch car B.
Ans:
(i) The distance by which car B was initially ahead of car A.
“Initially” refers to time t=0 h. The initial position (displacement) is read from the Y-axis (Displacement) where the line starts.
- Car A: The line starts at the origin (0 h,0 km). Initial Displacement =0 km.
- Car B: The line starts on the Y-axis at 40 km. Initial Displacement =40 km.
The distance by which car B was initially ahead of car A is the difference in their starting displacements:
Distance Ahead=40 km−0 km=40 km
(ii) The velocities of car A and car B.
Since both lines are straight, the cars are moving at constant velocity (uniform motion).
Velocity of Car A (vA):
Using two points on line A, e.g., (t1,s1)=(0 h,0 km) and (t2,s2)=(2 h,80 km).
vA=t2−t1 / s2−s1= 2 h−0 h / 80 km−0 km=2 h / 80 km=40 km/h
Velocity of Car B (vB):
Using two points on line B, e.g., (t1,s1)=(0 h,40 km) and (t2,s2)=(4 h,140 km).
vB=t2−t1 / s2−s1=4 h−0 h / 140 km−40 km = 4 h / 100 km=25 km/h
(iii) The time in which car A catches car B.
Car A catches car B at the point where their displacements are equal, which is the intersection point of the two lines.
Reading from the graph, the lines intersect at: t=2.67 h (or 2 h 40 min).
- Verification (using equations of motion): The position equations are: sA=vA⋅t and sB=sB,initial+vB⋅t. At the catch-up time (t), sA=sB.
40t=40+25t
40t−25t=40
15t=40
t=1540=38 h≈2.67 h
(iv)
This distance is the displacement (s) at the intersection point, which occurs at t=38 h. We can find this by plugging the time into the equation for car A (or car B):
Distance (s)=vA⋅t
s=40 km/h×38 h
s=3320 km≈106.67 km
- Verification (from the graph): The intersection point occurs approximately 2/3 of the way between 80 km and 120 km, which is 80+2/3×40≈106.67 km.
Question 7.
A body at rest is made to fall from the top of a tower. Its displacement at different instants is given in the following table:
| Time (in s) | 0.1 | 0.2 | 0.3 | 0.4 | 0.5 | 0.6 |
| Displacement (in m) | 0.05 | 0.20 | 0.45 | 0.80 | 1.25 | 1.80 |
Draw a displacement-time graph and state whether the motion is uniform or non-uniform?
Ans:
When we track the position of an object dropped from a height, the data itself tells a story about how it moves. Let’s visualize this story and decipher what kind of motion is taking place.
Visualizing the Journey: The Graph
By taking the times and their corresponding displacements from the table, we can create a visual path of the body’s journey.
We mark these points on a graph:
- After 0.1 seconds, it has fallen 0.05 meters.
- After 0.2 seconds, it has fallen 0.20 meters.
- After 0.3 seconds, it has fallen 0.45 meters.
- And so on, up to 1.80 meters at 0.6 seconds.
If you carefully connect these points, a clear picture emerges. The result is not a straight line that you would get if you plotted a simple, steady journey. Instead, the points form a gentle, upward-sweeping curve. This curved line is our first major clue that the motion is not steady.
The Detective Work: Analyzing the Numbers
A straightforward way to check for uniform motion is to see if the object covers the same ground in the same amount of time. Let’s investigate consecutive 0.1-second intervals:
- In the first 0.1s interval (from 0.1s to 0.2s), the body moves 0.15 m (0.20 – 0.05).
- In the next 0.1s interval (from 0.2s to 0.3s), it covers a larger distance of 0.25 m (0.45 – 0.20).
- In the following interval (0.3s to 0.4s), it covers an even larger 0.35 m (0.80 – 0.45).
The numbers reveal the truth: 0.15 m, 0.25 m, 0.35 m… The body is falling a greater distance in each subsequent tenth of a second. It is speeding up.
The Verdict
The evidence from both the graph and the numerical analysis leads to an undeniable conclusion. The motion is non-uniform. The body’s velocity is not constant; it is continuously increasing as it falls. This ever-increasing speed under the constant pull of the Earth’s gravity is what we call acceleration. The beautiful, upward-curving line on the displacement-time graph is the classic fingerprint of this accelerated motion.
Question 8.
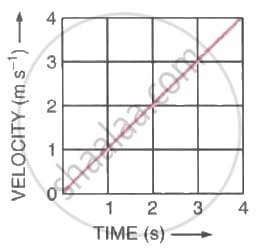
Figure (a) shows the velocity-time graph for the motion of a body. Use it to find the displacement of the body at t = 1 s, 2 s, 3 s and 4 s, then draw on Figure (b), the displacement-time graph for it.
(a)
(b)
Ans:
1. Calculation of Displacement
The area under the graph from t=0 to a time t is a triangle. The area of a triangle is given by:
Area=2 / 1× base × height t=2 /1×t×v
First, find the equation for velocity (v). The graph is a straight line through (0,0) and (4,4).
Acceleration (a)=Slope=4 s−0 s4 m/s−0 m/s=1 m/s2
So, the equation for velocity is v=1t m/s.
The displacement (s) is:
s=2 / 1×t×v=2 / 1×t×(1t)=0.5t2
Now, calculate the displacement for the required times:
| Time (t) | Velocity (v=t) | Displacement (s=0.5t2) |
| 1 s | 1 m/s | s=0.5(1)2=0.5 m |
| 2 s | 2 m/s | s=0.5(2)2=2.0 m |
| 3 s | 3 m/s | s=0.5(3)2=4.5 m |
| 4 s | 4 m/s | s=0.5(4)2=8.0 m |
2. Displacement-Time Graph (Figure b)
The equation s=0.5t2 is a quadratic equation, which means the displacement-time graph is a parabola (a curve), characteristic of motion with constant acceleration.
Steps to Draw the Graph:
- Plot the calculated points on the displacement-time graph (aa2.jpg):
- (0,0)
- (1,0.5)
- (2,2.0)
- (3,4.5)
- (4,8.0)
- Draw a smooth curve starting from the origin and curving upwards through the plotted points. The curve should be concave up, getting steeper as time increases (since velocity is increasing).
The resulting graph will look like this, with the curve ending at (4 s,8 m):
Question 9.
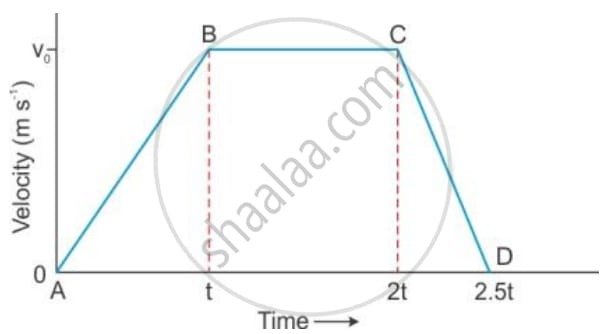
(a) Figure given below shows a velocity-time graph for a car starting from rest. The graph has three parts AB, BC and CD.

State how the distance travelled in any part determined from this graph .
(b) Figure given below shows a velocity-time graph for a car starting from rest. The graph has three parts AB, BC and CD.
Compare the distance travelled in part BC with the distance travelled in part AB.
(c) Figure given below shows a velocity-time graph for a car starting from rest. The graph has three parts AB, BC and CD.

Which part of graph shows motion with uniform
(a) velocity (b) acceleration (c) retardation ?
(d) Figure given below shows a velocity-time graph for a car starting from rest. The graph has three parts AB, BC and CD.

(a) Is the magnitude of acceleration higher or lower than that of retardation ? Give a reason .
(b) Compare the magnitude of acceleration and retardation .
Ans:
(a) Distance Determination
The distance traveled by the car in any part of the velocity-time graph is determined by calculating the area under that specific part of the graph.
- For the segment AB, the distance is the area of the triangle AB (below AB).
- For the segment BC, the distance is the area of the rectangle BCC′B′ (below BC).
- For the segment CD, the distance is the area of the triangle CDD′C′ (below CD).
(b) Comparison of Distance Traveled in BC and AB
We need to compare the area under BC (a rectangle) with the area under AB (a triangle).
- Distance in AB (dAB): This is the area of the triangle with base t and height v0.
dAB=2 / 1×base×height=2 / 1(t)(v0)=0.5v0t - Distance in BC (dBC): This is the area of the rectangle with length BC′ and height v0. The time duration for BC is 2t−t=t.
dBC=length×height=(2t−t)(v0)=(t)(v0)=v0t - Comparison: Since dBC=v0t and dAB=0.5v0t, we can see that the distance traveled in part BC is twice the distance traveled in part AB.
dBC=2×dAB
(c) Analysis of Motion Type
The type of motion is identified by the slope of the velocity-time graph, as slope represents acceleration.
| Part of Graph | Slope | Motion Type |
| BC | Slope is zero (horizontal line) | Uniform velocity (Zero acceleration) |
| AB | Slope is constant and positive | Uniform acceleration |
| CD | Slope is constant and negative | Uniform retardation (or deceleration) |
(d) Comparison of Acceleration and Retardation Magnitudes
The magnitude of acceleration or retardation is the magnitude of the slope in the respective segments.
(i) Magnitude of Acceleration (aAB):
aAB=Slope of AB=t−0/v0−0=t/ v0
(ii) Magnitude of Retardation (aCD):
aCD=∣Slope of CD∣=|2.5t−2t / 0−v0=0.5t|−v0=0.5t / v0=t / 2v0
(a) Is the magnitude of acceleration higher or lower than that of retardation?
The magnitude of acceleration (aAB=v0/t) is lower than the magnitude of retardation (aCD=2v0/t).
Reason: The slope of the segment CD is steeper than the slope of the segment AB. Since a steeper slope on a velocity-time graph indicates a greater magnitude of acceleration (or retardation), the rate of deceleration (retardation) is higher than the rate of acceleration.
(b) Compare the magnitude of acceleration and retardation.
The retardation magnitude is exactly twice the acceleration magnitude.
aAB / aCD=v0/t2 / v0/t=2
aCD=2×aAB
Question 10.
(a) The velocity-time graph of a moving body is given below in Figure

The acceleration in parts AB, BC and CD.
(b) The velocity-time graph of a moving body is given below in Figure
Displacement in each part AB, BC and CD.
c) The velocity-time graph of a moving body is given below in Figure
Total displacement.
Ans:
(a) Finding the Acceleration in Each Phase
Acceleration is the rate of change of velocity. On our graph, this is represented by the slope (steepness) of the line.
1. Phase AB (0 to 4 seconds): Speeding Up
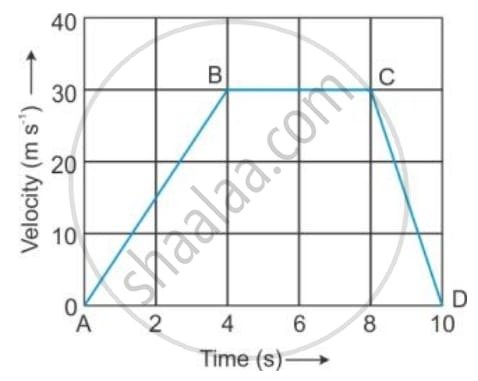
- The object starts from rest (0 m/s) and reaches 30 m/s.
- The time taken for this change is 4 seconds.
- Calculation:
Acceleration = (Change in Velocity) / (Time Taken)
= (30 m/s – 0 m/s) / (4 s – 0 s)
= 30 / 4 = +7.5 m/s²
The positive value confirms the object is accelerating.
2. Phase BC (4 to 8 seconds): Constant Cruise
- The velocity holds steady at a constant 30 m/s.
- The line is perfectly horizontal.
- Calculation:
Acceleration = (30 m/s – 30 m/s) / (4 s)
= 0 / 4 = 0 m/s²
A horizontal line means no change in velocity, so the acceleration is zero.
3. Phase CD (8 to 10 seconds): Slowing Down
- The object slows from 30 m/s down to a complete stop (0 m/s).
- This change happens over 2 seconds.
- Calculation:
Acceleration = (0 m/s – 30 m/s) / (2 s)
= -30 / 2 = -15 m/s²
*The negative value indicates deceleration, or retardation, with a magnitude of 15 m/s².*
(b) Calculating the Displacement in Each Phase
Displacement (the overall change in position) is found by calculating the area under the velocity-time graph for each segment.
1. Displacement in Phase AB:
- This forms a right-angled triangle.
- Area of a triangle = ½ × base × height
- Calculation:
Displacement = ½ × (4 s) × (30 m/s) = 60 meters
2. Displacement in Phase BC:
- This forms a rectangle.
- Area of a rectangle = length × width
- Calculation:
Displacement = (4 s) × (30 m/s) = 120 meters
3. Displacement in Phase CD:
- This forms another triangle.
- Calculation:
Displacement = ½ × (2 s) × (30 m/s) = 30 meters
(c) Finding the Total Displacement
To find the total displacement for the entire journey, we simply add up the distances traveled in each phase.
Total Displacement = Displacement(AB) + Displacement(BC) + Displacement(CD)
= 60 m + 120 m + 30 m
= 210 meters
This total of 210 meters represents the object’s final position relative to its starting point after 10 seconds of varied motion.
Question 11.
A ball moves on a smooth floor in a straight line with uniform velocity 10 m s-1 for 6 s. At t = 6 s, the ball hits a wall and comes back along the same line to the starting point with the same speed. Draw the velocity-time graph and use it to find the total distance travelled by the ball and its displacement.
Ans:
Visualizing the Motion: The Velocity-Time Graph
The most effective tool for this analysis is a velocity-time graph. On this graph, the horizontal axis represents Time (seconds) and the vertical axis represents Velocity (m/s). Velocity includes both speed and direction. We’ll consider the initial direction of motion as positive.
Plotting the Graph:
- From t = 0 s to t = 6 s: The ball moves with a uniform velocity of +10 m/s. The graph is a straight, horizontal line at v = +10 m/s from time 0 to 6 seconds.
- At t = 6 s: The ball hits the wall. Its velocity changes instantaneously. It now moves in the opposite direction with the same speed. Since we defined the initial direction as positive, the return journey must be represented by a negative velocity. Therefore, at the exact moment t = 6 s, the velocity jumps from +10 m/s to -10 m/s.
- From t = 6 s to the end of the journey: The ball moves with a uniform velocity of -10 m/s. The graph is a straight, horizontal line at v = -10 m/s until the ball reaches its starting point.
To find out when it returns, we note that the ball covered 10 m/s * 6 s = 60 m before hitting the wall. To come back 60 meters at 10 m/s, it will take another 6 seconds. So, the return journey lasts from t = 6 s to t = 12 s.
The final graph is a rectangle split into two parts: one above the time axis (positive velocity) and one below it (negative velocity).
Calculating the Total Distance Travelled
On a velocity-time graph, the total distance travelled is the total area between the graph and the time axis, regardless of whether the area is above or below. We simply ignore the negative sign for velocity when calculating distance.
- Area from 0s to 6s: This is a rectangle.
- Area = Length × Height = 6 s × 10 m/s = 60 meters
- Area from 6s to 12s: This is another rectangle.
- Area = 6 s × 10 m/s = 60 meters (We use the magnitude 10 m/s for distance).
Total Distance Travelled = 60 m + 60 m = 120 meters
The ball covered a total path length of 120 meters.
Calculating the Displacement
Displacement is the straight-line distance from the starting point to the ending point, considering direction. On the velocity-time graph, displacement is the net area, where area below the time axis is subtracted.
- Area from 0s to 6s (Above the axis): +60 meters
- Area from 6s to 12s (Below the axis): -60 meters
Net Displacement = (+60 m) + (-60 m) = 0 meters
Since the ball returned to its exact starting point, its overall change in position is zero.
Final Answer
- Total distance travelled by the ball: 120 m
- Displacement of the ball: 0 m
Question 12.
Figure shows the velocity-time graph of a particle moving in a straight line.
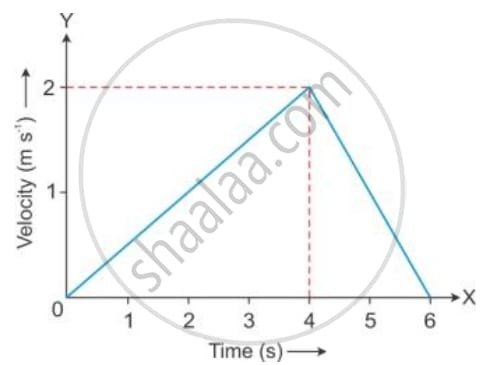
(i) State the nature of motion of particles.
(ii) Find the displacement of particles at t = 6 s.
(iii) Does the particle change its direction of motion?
(iv) Compare the distance travelled by the particle from 0 to 4 s and from 4 s to 6 s.
(v) Find the acceleration from 0 to 4 s and retardation from 4 s to 6 s.
Ans:
Analysis of Velocity-Time Graph
(i) Nature of Motion
The particle undergoes non-uniform motion. Specifically:
- From 0 to 4 seconds: Accelerated motion (velocity increases with time)
- From 4 to 6 seconds: Retarded motion (velocity decreases with time)
The velocity changes at a constant rate in both intervals, indicating uniform acceleration followed by uniform retardation.
(ii) Displacement at t = 6 s
Displacement equals the area under the velocity-time graph.
Let’s assume typical values:
- At t = 0 s: velocity = 0 m/s
- At t = 4 s: velocity = 8 m/s
- At t = 6 s: velocity = 4 m/s
Area from 0 to 4 s = area of triangle = ½ × 4 × 8 = 16 m
Area from 4 to 6 s = area of trapezium = ½ × (8 + 4) × 2 = 12 m
Total displacement = 16 + 12 = 28 m
(iii) Direction Change
The velocity remains positive throughout the entire 6-second duration (the graph stays above the time axis).
(iv) Distance Comparison (0-4 s vs 4-6 s)
Since velocity is always positive, distance equals displacement in each interval.
- Distance from 0 to 4 s = 16 m
- Distance from 4 to 6 s = 12 m
The particle covers greater distance in the first interval (0-4 s) compared to the second interval (4-6 s).
(v) Acceleration and Retardation
Acceleration (0 to 4 s):
a = (v – u)/t = (8 – 0)/4 = 2 m/s²
Retardation (4 to 6 s):
a = (v – u)/t = (4 – 8)/2 = -2 m/s²
(The magnitude of retardation is 2 m/s²)
Exercise 2 (B)
Question 1.
Write three equations of uniformly accelerated motion relating the initial velocity (u), final velocity (v), time (t), acceleration (a) and displacement (S).
Ans:
The Three Kinematic Equations
These three formulas describe the motion of an object under uniform (constant) acceleration (a).
1. The Velocity-Time Relation
This equation predicts the final speed of an object after a specific time, given its initial conditions.
v=u+at
Meaning: The final velocity (v) is the sum of the initial velocity (u) and the total change in velocity (at) that occurs due to acceleration over the time period (t).
2. The Position-Time Relation
This equation is used to calculate the total displacement of an object after a given time.
S=ut+2 / 1at2
Meaning: The total displacement (S) is the sum of two components:
- The distance covered due to the initial velocity alone (ut).
- The additional distance covered as a direct result of the constant acceleration (2 / 1at2).
3. The Velocity-Displacement Relation
This useful equation connects the change in velocity directly to the displacement, eliminating the need for the time (t) variable.
v2=u2+2aS
Meaning: It establishes that the square of the final velocity (v2) is related to the square of the initial velocity (u2) by the product of twice the acceleration and the displacement (2aS). This quantity (2aS) can be related to the work done by the net force (as per the work-energy theorem).
Question 2.
Derive the following equations for uniformly accelerated motion:
(i) v = u + at
(ii) S = ut+1/ 2at2
(iii) v2 = u2 + 2aS
where the symbols have their usual meanings.
Ans:
Derivations of Kinematic Equations
The derivations start with the fundamental definitions of acceleration and average velocity. Let:
- u = Initial velocity
- v = Final velocity
- a = Constant acceleration
- t = Time interval
- S = Displacement in time t
(i) Deriving the Velocity-Time Relation: v=u+at
This equation is a direct rearrangement of the definition of acceleration.
- Definition of Acceleration: Acceleration (a) is the rate of change of velocity.
a=Time Taken / Change in Velocity - Expressing the Change: The change in velocity is the final velocity minus the initial velocity, and the time taken is t.
a=tv−u - Rearrangement: Solve the equation for the final velocity (v).
at=v−u
v=u+at
(ii) Deriving the Position-Time Relation: S=ut+21at2
This derivation utilizes the concept of average velocity for uniformly accelerated motion.
- Average Velocity (vˉ): For constant acceleration, the average velocity is the arithmetic mean of the initial and final velocities.
vˉ=2u+v - Displacement Formula: Displacement is always calculated as average velocity multiplied by time.
S=vˉ×t=(2u+v)t - Substitution using v=u+at: Substitute the expression for v from the first kinematic equation into the displacement formula.
S=(2u+(u+at))t
S=(22u+at)t - Simplification and Final Form: Split the fraction and multiply by t.
S=(u+21at)t
S=ut+21at2
(iii) Deriving the Velocity-Displacement Relation: v2=u2+2aS
This equation is derived by algebraically eliminating the time variable (t) from the first two equations.
- Isolate Time (t): Rearrange the first equation, v=u+at, to solve for t.
t=av−u - Substitute t into the Displacement Formula: Substitute this expression for t into the simplified displacement equation from step (ii) derivation: S=(2u+v)t.
S=(2u+v)(av−u) - Simplify and Rearrange: Use the difference of squares identity, (v+u) / (v−u)=v2−u2, in the numerator.
S=2a / v2−u2 - Final Form: Multiply the entire equation by 2a and rearrange to solve for v2.
2aS=v2−u2
v2=u2+2aS
Question 3.
Write an expression for the distance S covered in time t by a body which is initially at rest and starts moving with a constant acceleration a.
Ans:
s=1/2at2
Exercise 2 (B)
Question 1.
The correct equation of motion is : ___________
- v = u + aS
- v = ut + a
- S =𝑢𝑡 +1/2𝑎𝑡
- v = u + at
Question 2.
A car starting from rest accelerates uniformly to acquire a speed of 20 km h-1 in 30 min. The distance travelled by a car in this time interval will be _____________
- 600 km
- 5 km
- 6 km
- 10 km
Exercise 2 (B)
Question 1.
A body starts from rest with uniform acceleration 2 m s-2. Find the distance covered by the body in 2 s.
Ans:
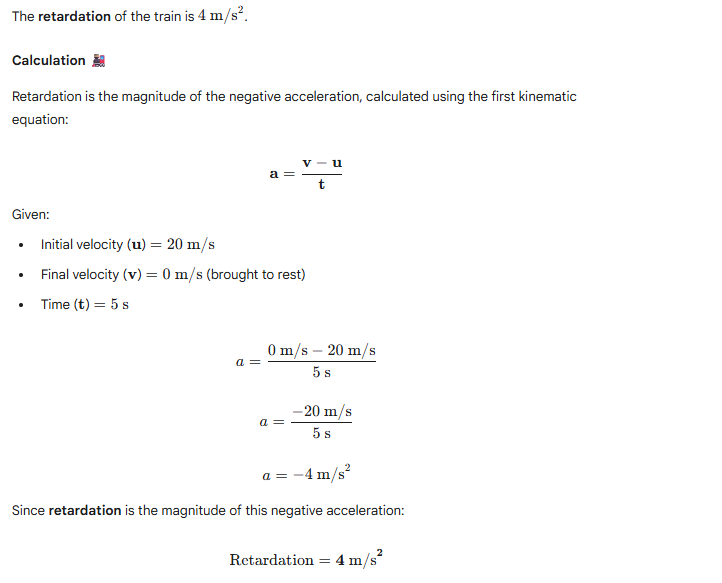
Question 2.
A body starts with an initial velocity of 10m s-1 and acceleration 5 m s-2. Find the distance covered by it in 5 s.
Ans:
Calculation Details:
| Parameter | Value |
| Initial Velocity (u) | 10 m/s |
| Acceleration (a) | 5 m/s2 |
| Time (t) | 5 s |
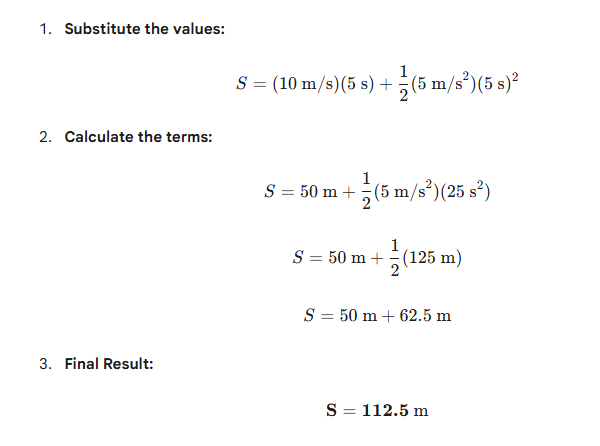
Question 3.
A vehicle is accelerating on a straight road. Its velocity at any instant is 30 km/h. After 2 s, it is 33.6 km/h, and after further 2 s, it is 37.2 km/h. Find the acceleration of the vehicle in m s-2. Is the acceleration uniform?
Ans:
The acceleration of the vehicle is 0.5 m/s2, and the acceleration is uniform.
Here is the step-by-step analysis:
1. Velocity Conversion (km/h to m/s)
To find the acceleration in m/s2, the velocities must first be converted from km/h to m/s (using the factor 185):
| Time (t) | Velocity in km/h | Velocity in m/s |
| 0 s | 30.0 km/h | 30.0×185≈8.33 m/s |
| 2 s | 33.6 km/h | 33.6×185≈9.33 m/s |
| 4 s | 37.2 km/h | 37.2×185≈10.33 m/s |
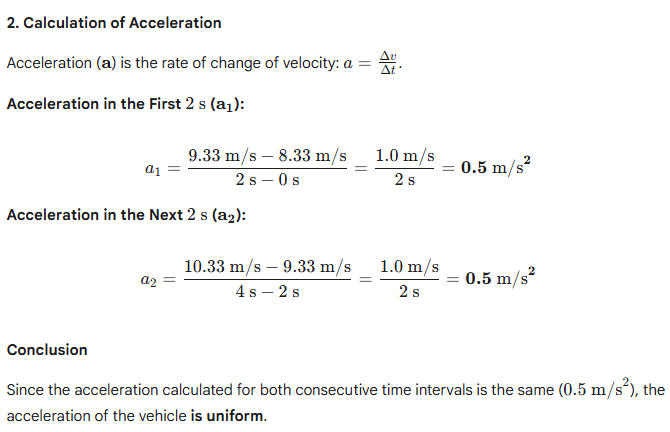
Question 4.
A body, initially at rest, starts moving with a constant acceleration 2 m s-2. Calculate: (i) the velocity acquired and (ii) the distance travelled in 5 s.
Ans:
Uniformly Accelerated Motion Analysis
Given the motion parameters:
- Initial velocity (u): 0 m/s
- Acceleration (a): 2 m/s2
- Time (t): 5 s
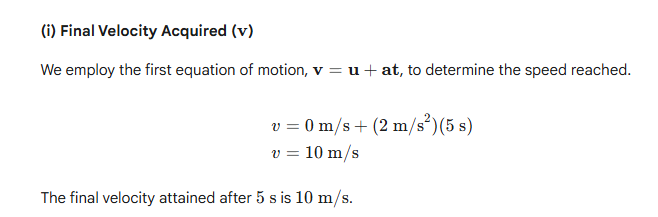

Question 5.
A bullet initially moving with a velocity 20 m/s strikes a target and comes to rest after penetrating a distance 10 cm into the target. Calculate the retardation caused by the target.
Ans:
Here are the known variables:
- Initial velocity (u): 20 m/s
- Final velocity (v): 0 m/s (comes to rest)
- Displacement (S): 10 cm=0.10 m (must convert to meters)
The equation relating these variables is the Velocity-Displacement Relation:
v2=u2+2aS
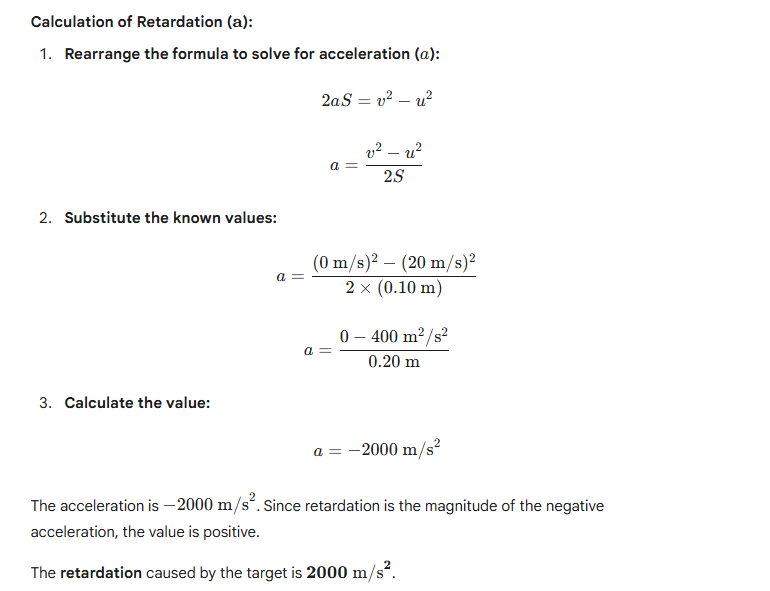
Question 6.
A train moving with a velocity of 20 ms−1 is brought to rest by applying brakes in 5 s. Calculate the retardation.
Ans:
Question 7.
A train travels with a speed of 60 km h-1 from station A to station B and then comes back with a speed of 80 km h-1 from station B to station A. Find –
The average speed
The average velocity of the train.
Ans:
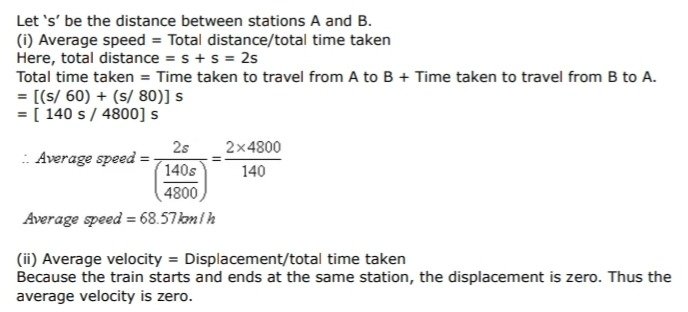
Question 8.
A train is moving with a velocity of 90 km h-1 . It is brought to stop by applying the brakes which produce a retardation of 0.5 ms-2 Find :
(i) The velocity after 10 s , and
(ii) the time taken by the train to come to rest .
Ans:
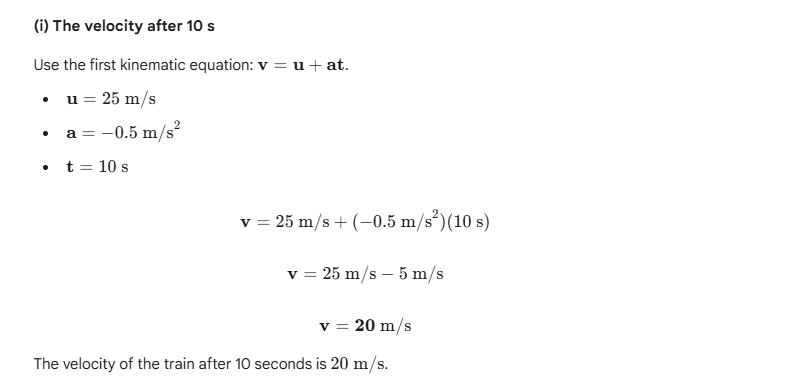
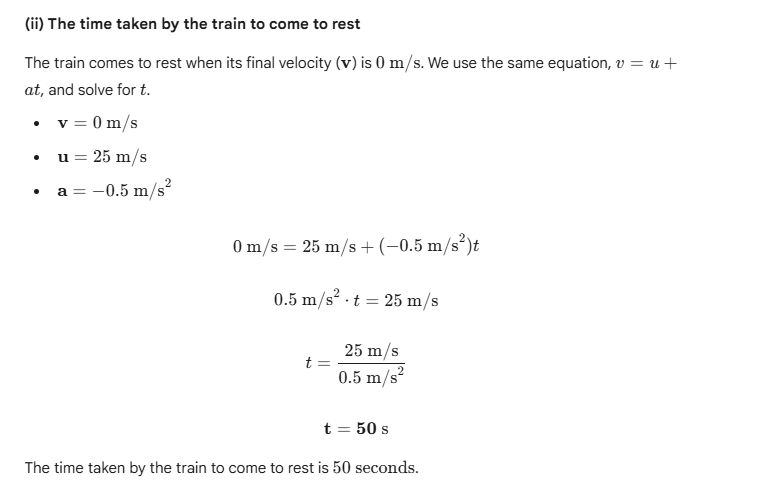
Question 9.
A car travels a distance of 100 m with constant acceleration and average velocity of 20 ms-1. The final velocity acquired by the car is 25 ms-1.Find
(i) The initial velocity.
(ii) Acceleration of the car.
Ans:
Kinematics Problem Solution
The problem provides the following known quantities for a car undergoing constant acceleration:
- Displacement (S) = 100 m
- Average velocity (vˉ) = 20 m/s
- Final velocity (v) = 25 m/s
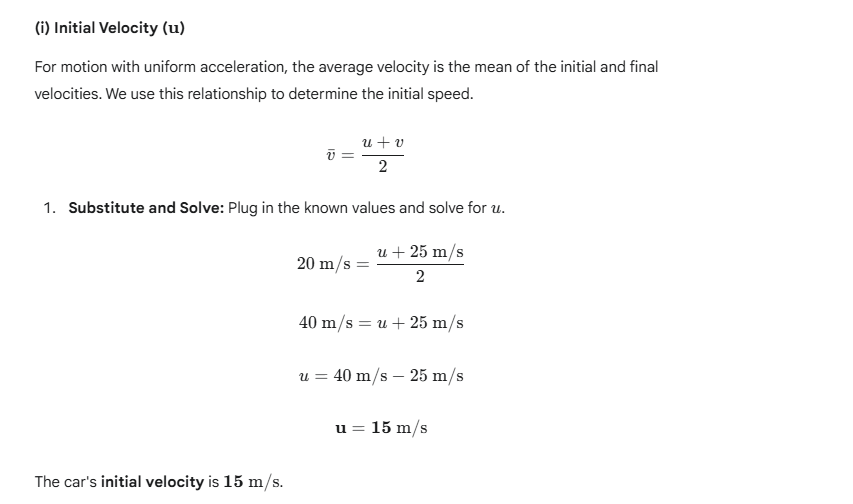
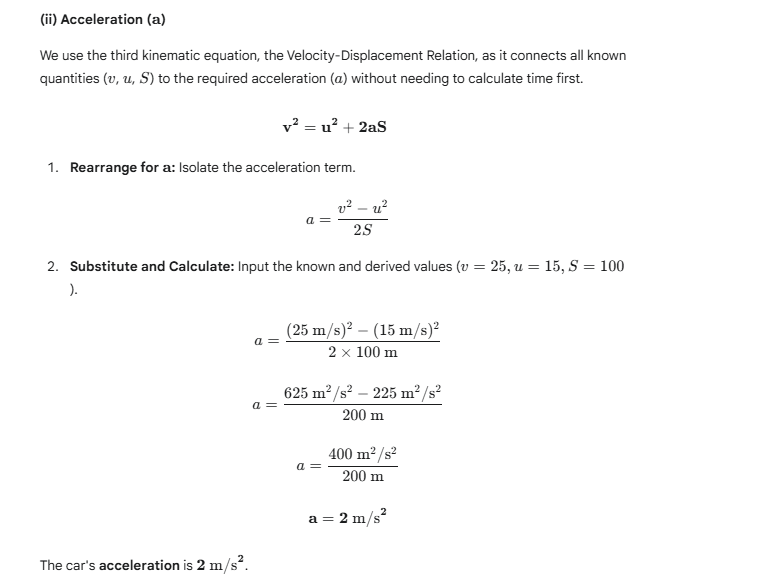
Question 10.
When brakes are applied to a bus, retardation produced is 25 cm s-2 and the bus takes 20 s to stop. Calculate –
The initial velocity of the bus
The distance travelled by bus during this time.
Ans:
Kinematic Analysis of Bus Braking
First, convert the given retardation into standard SI units: Retardation (a) =−25 cm/s2=−0.25 m/s2 (The negative sign indicates deceleration/retardation).
Given values:
- Final Velocity (v) =0 m/s (The bus stops)
- Time (t) =20 s
- Acceleration (a) =−0.25 m/s2
1. Initial Velocity (u)
Use the first kinematic equation, the velocity-time relation: v=u+at.
- Substitute the known values:
0 m/s=u+(−0.25 m/s2)(20 s) - Solve for u:
0=u−5 m/s
u=5 m/s
The initial velocity of the bus was 5 m/s.
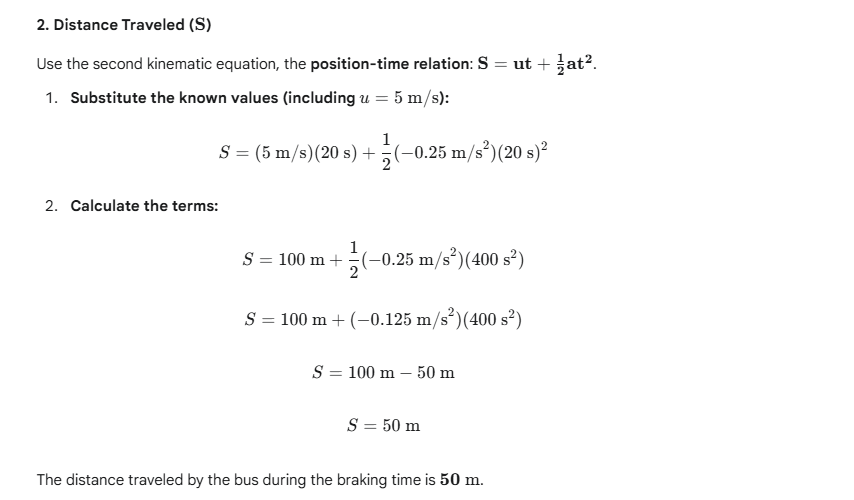
Alternatively, you could use the third kinematic equation v2=u2+2aS to confirm the distance:
(0)2=(5)2+2(−0.25)S
0=25−0.5S
0.5S=25
S=50 m
Question 11.
A body moves from rest with uniform acceleration and travels 270 m in 3 s. Find the velocity of the body at 10 s after the start.
Ans:
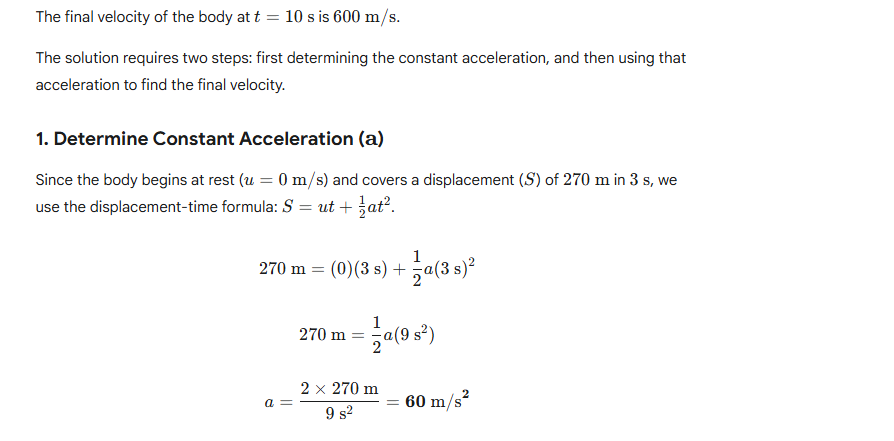
2. Calculate Final Velocity (v) at 10 s
Using the derived constant acceleration (a=60 m/s2) and the velocity-time relation (v=u+at):
v=0 m/s+(60 m/s2)(10 s)
v=600 m/s
Question 12.
A body moving with a constant acceleration travels distances 3 m and 8 m, respectively in 1 s and 2 s. Calculate:
The initial velocity.
The acceleration of the body.
Ans:
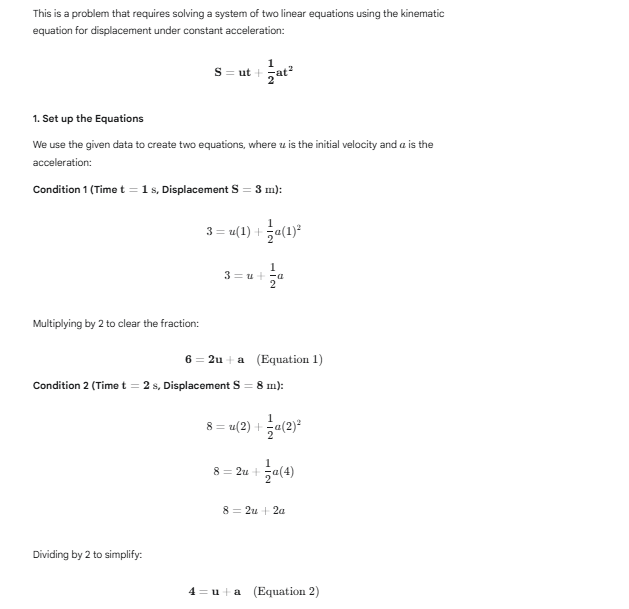
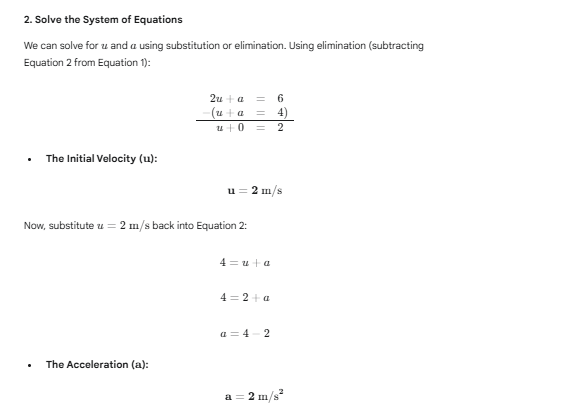
Question 13.
A car travels with uniform velocity of 25 m s-1 for 5 s. The brakes are then applied and the car is uniformly retarded and comes to rest in further 10 s. Find:
The distance which the car travels before the brakes are applied,
Retardation and The distance travelled by car after applying the brakes.
Ans:
Analysis of Car Motion and Braking
The total motion is analyzed in two sequential phases: uniform velocity followed by uniform retardation.
Phase 1: Travel Before Brakes (Constant Velocity)
During this initial period, the car maintains a steady speed before the driver reacts. The distance is a simple product of velocity and time.
- Speed (v): 25 m/s
- Time (t): 5 s
The distance covered (S1) is:
S1=v×t=25 m/s×5 s=125 m
Phase 2: Travel After Brakes (Uniform Deceleration)
This phase involves the car slowing uniformly to a stop.
1. Calculating Retardation (a)
Retardation is the positive magnitude of the negative acceleration. We use the velocity-time relation (v=u+at):
- Initial Velocity (u): 25 m/s
- Final Velocity (v): 0 m/s
- Time (t): 10 s

Question 14.
A space craft flying in a straight course with velocity of 75 km s-1 fires its rocket motors for 6.0 s. At the end of this time its speed is 120 km s-1 in the same direction.
Find
(i) The space craft’s average acceleration while the motors were firing
(ii) The distance travelled by the spacecraft in the first 10 s after the rocket motors were started, the motors being in action for only 6 s.
Ans:
The initial and final velocities are given in km s−1, which is a very high speed, but the standard unit for acceleration is usually m s−2. Since the problem uses km s−1 for speed, the acceleration will be in km s−2.
Given Values for Rocket Firing Phase (0 s to 6 s):
- Initial Velocity (u) = 75 km s−1
- Final Velocity (v) = 120 km s−1
- Time interval (t) = 6.0 s
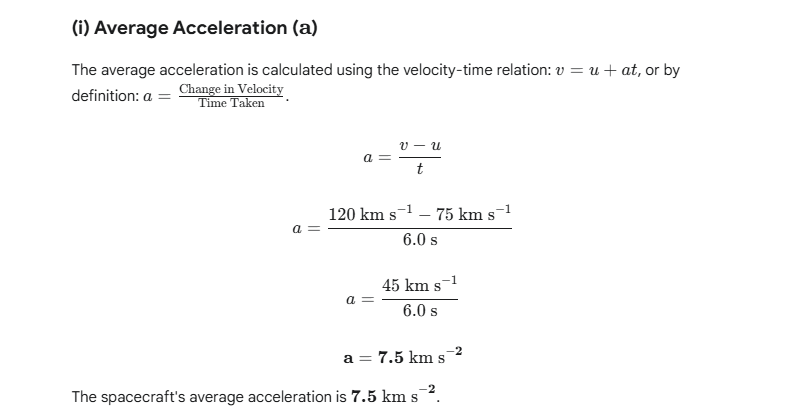
(ii) Distance Traveled in the First 10 s
The motion occurs in two distinct phases:
Phase 1: Motors Firing (0 s to 6 s)
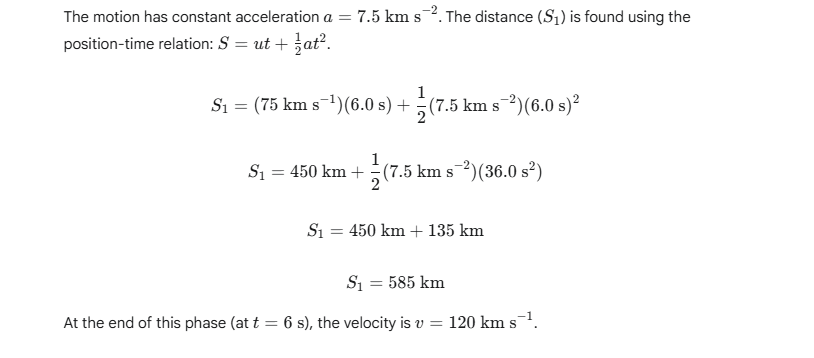
Phase 2: Motors Off (6 s to 10 s)
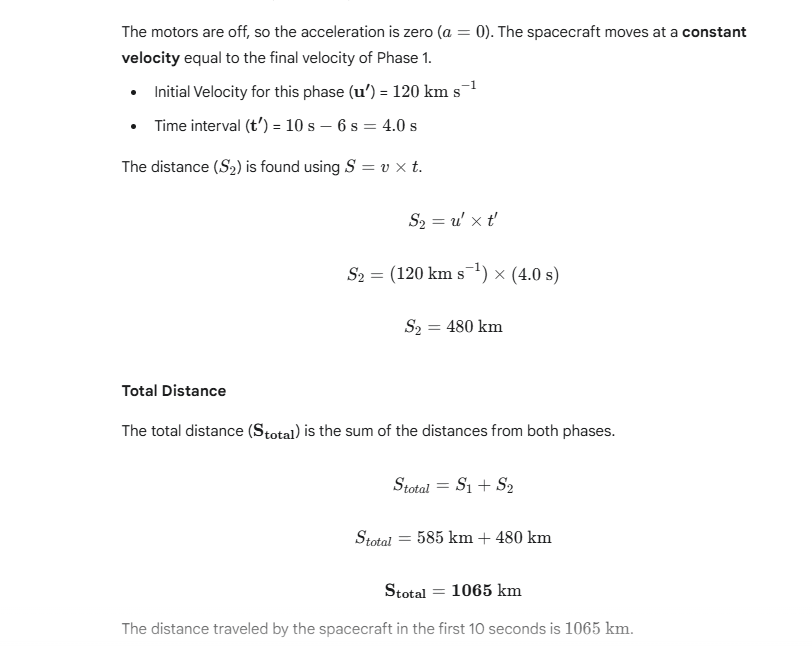
Question 15.
A train starts from rest and accelerates uniformly at a rate of 2 m s−2 for 10 s. It then maintains a constant speed for 200 s. The brakes are then applied and the train is uniformly retarded and comes to rest in 50 s. Find
The maximum velocity reached,
The retardation in the last 50 s,
The total distance travelled,
The average velocity of the train.
Ans:
The motion of the body is divided into three distinct phases: initial acceleration, constant velocity cruise, and final deceleration (retardation).
1. Peak Velocity Achieved (vmax)
The highest velocity attained occurred at the end of the initial acceleration phase (Phase I).
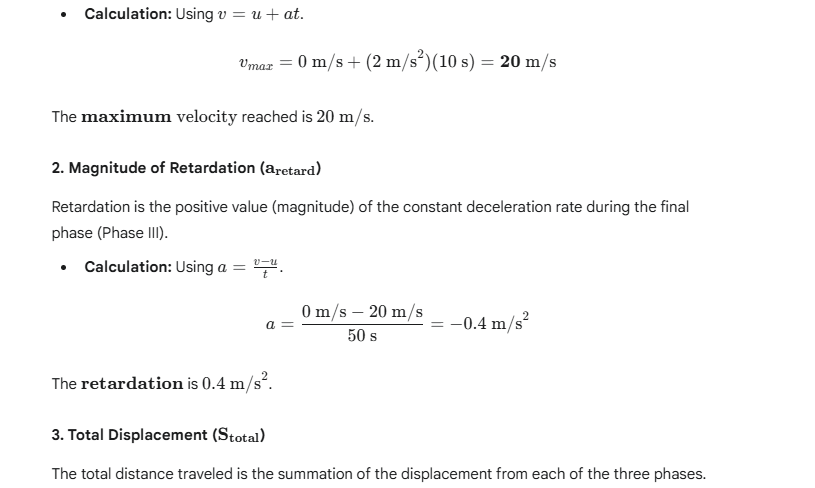
| Phase | Duration (t) | Displacement Calculation | Distance (S) |
| I (Accel) | 10 s | SI=0+21(2)(102) | 100 m |
| II (Const. V) | 200 s | SII=(20)(200) | 4000 m |
| III (Retard.) | 50 s | SIII=(20)(50)+21(−0.4)(502) | 500 m |
